Using the Bollinger Bands (BB) and Relative Strength Index (RSI) Strategy for Turbo Options
Master the Turbo options with the Bollinger Bands (BB) and Relative Strength Index (RSI) strategy. Enhance accuracy, identify overbought/oversold levels, and trade with confidence. Learn how now!
-
 Saqib Iqbal
- 7 min read
Do you want to learn about the Bollinger Bands (BB) + Relative Strength Index (RSI) strategy for Turbo options? Well, you’ve come to the right place! This article contains an in-depth analysis of this strategy and how you can use it to profit in online trading.
WHAT IS A TURBO OPTION?
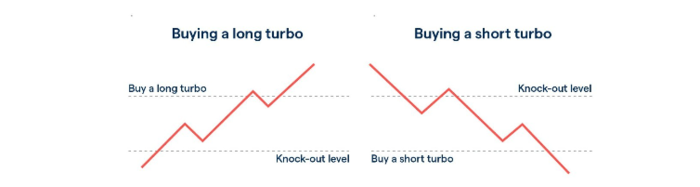
Alternatively referred to as Turbo warrants or certificates, Turbos are leveraged financial instruments. Their value closely follows the price movement of an underlying asset, allowing for both long and short positions.
To manage risk, each Turbo trade includes a predefined knock-out level. If the price reaches these levels, the trade is terminated.
Unlike over-the-counter (OTC) trading, you trade Turbos on a platform with transparent order books. This visibility enables you to assess market sentiment, gather information, and strategize accordingly.
What Are Bollinger Bands (BB)?
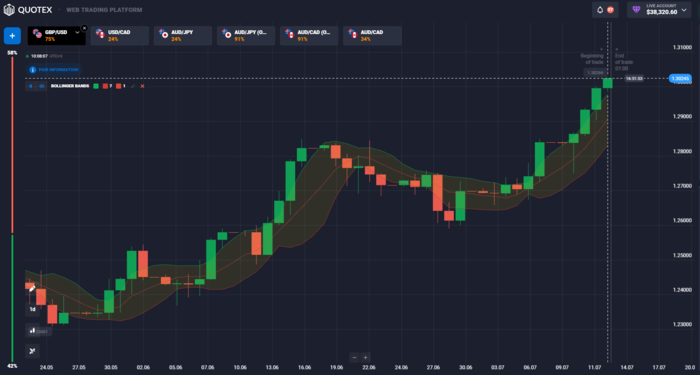
Bollinger Bands, created by John Bollinger, are a price envelope that establishes upper and lower price range levels. These bands are above and below a simple moving price average at certain standard deviations. You can see this in the chart below. By utilizing standard deviation, the bands adapt to changes in volatility.
Bollinger Bands rely on two parameters: the period and standard deviations (StdDev). The default values are 20 for the period and 2 for standard deviations, but you can customize these settings.
The main purpose of Bollinger Bands is to assess whether prices are relatively high or low. They are used with a moving average and consist of both upper and lower bands. It’s important to note that these bands are not meant to be used in isolation but rather to confirm signals that other indicators provide.
What Is the Relative Strength Index (RSI)?
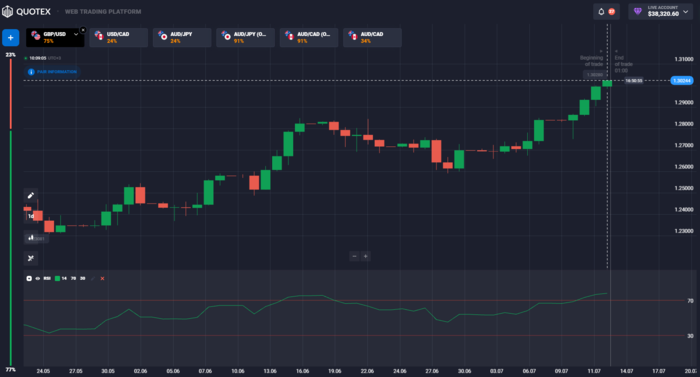
The Relative Strength Index (RSI) is a technical analysis tool that measures the speed and magnitude of recent price changes in an asset. It helps determine whether the security is overvalued or undervalued.
This indicator is a favorite because of how clean and simple it is. Traders will often use it with other tools as well, leading to positive outcomes.
The RSI is an oscillator on a scale of 0 to 100. J. Welles Wilder Jr. created and introduced it in his influential book New Concepts in Technical Trading Systems in 1978.
Apart from identifying overbought and oversold securities, the RSI can also provide insights into potential trend reversals or corrective pullbacks in price. You can use it as a signal for buying and selling. An RSI reading of 70 or above suggests an overbought condition.
How to Use BB + RSI Strategy for Turbo Options
Here is how you can use the Bollinger Band (BB) + Relative Strength Index (RSI) strategy.
First, you should identify prices that reach the upper or lower band. These instances often lead to price reversals due to reaching extreme levels. When the price reaches the upper band, it indicates an overbought condition. Hitting the lower band indicates that the price is oversold.
Additionally, monitoring the RSI value, which surpasses 70 for overbought and falls below 30 for oversold, is crucial. However, it’s important to remember that the RSI is an early warning signal before the trend reverses. The price may not react immediately when the RSI enters the oversold or overbought region. It could take several days before the trend reverses.
With that in mind, if an asset’s price touches the upper band of the Bollinger Bands and simultaneously the RSI surpasses 70, it signifies an overbought condition, indicating a potential selling opportunity. Conversely, if you’re seeking a buying signal, wait for the price to reach the lower band of the Bollinger Bands and observe the RSI below 30.
COMMON MISCONCEPTIONS ABOUT THE BB + RSI STRATEGY FOR TURBO OPTIONS
Below is a list of some common misconceptions that you should know about the BB + RSI strategy.
Misconception 1: False Signals of Buy/Sell
It’s a common misconception that this strategy gives off false buy/sell signals. This is inaccurate. Like any strategy, the BB + RSI strategy increases your chances of profiting from a trade, but it doesn’t assure it. Depending on your competence as a trader, you can make the strategy work for you or not.
Misconception 2: Not Suitable for All Types of Trading Platforms
You can use the BB + RSI strategy on all trading platforms with the two technical indicators. This includes the Quotex trading platform.
Misconception 3: No Regulatory Broker Involved
Regulatory brokers ensure that business between you and brokers is ethical and fair. Therefore, using the BB + RSI strategy on Quotex involves a regulatory broker that ensures your broker doesn’t exploit you.
Misconception 4: Unsuccessful Trading Strategies
The success rate of the BB + RSI trading strategy depends highly on you as a trader. To say that the strategy is unsuccessful is inaccurate because it depends greatly on your trading psychology. The success of this strategy, like with all trading strategies, depends very much on the individual trader.
ADVANTAGES OF THE BB + RSI STRATEGY FOR TURBO OPTIONS
Here are a few advantages you can experience when using the BB + RSI strategy for trading Turbo options.
Advantage 1: Accurate Information on Market Conditions
You can gain a more holistic market perspective by combining the data from Bollinger Bands and the RSI. This improves your accuracy regarding the market conditions.
Advantage 2: Improved Accuracy on Price Movements
By employing the two technical indicators, your entry and exit positions often become more accurate. The confluence of the two indicators increases your accuracy.
Advantage 3: Opportunity to Identify Oversold Levels and Resistance Levels
When the price surpasses the upper band, and the RSI goes beyond 70, it confirms an overbought situation, suggesting a potential sell signal. Conversely, when the price touches the lower band and the RSI falls below 30, it confirms a condition of oversold. This hints at a possible buy signal.
IMPLEMENTING THE BB + RSI STRATEGY FOR TURBO OPTIONS
Finally, let me show you how to implement the BB + RSI strategy to trade Turbo options.
Bollinger Bands show three lines on a chart that are especially useful. These lines consist of a middle line (usually a moving average) and an upper and lower band. The upper band is two standard deviations higher than the central line, while the lower is two standard deviations lower. Traders can analyze price volatility and identify overbought and oversold positions using these lines.
The RSI indicator shows an overbought market when it goes over level 70 and an oversold market when it goes below 30.
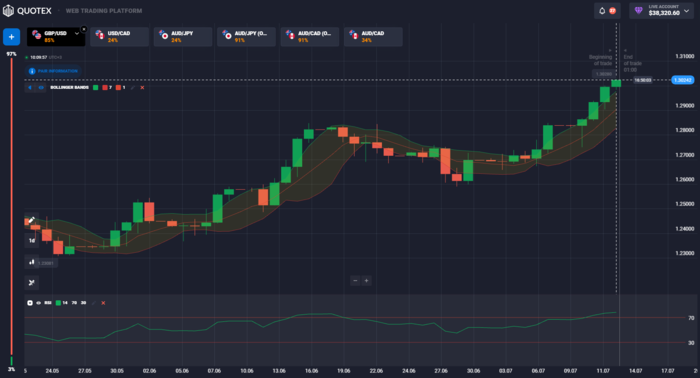
Take a look at the following chart with a buy and a sell entry.
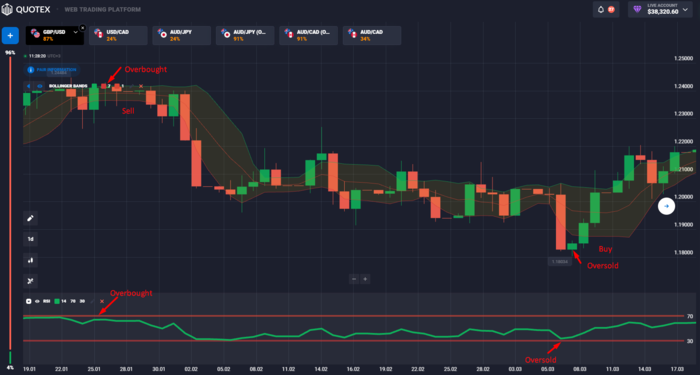
When the price hits the upper band of the BB and the RSI is overbought, it signals a potential sell entry for your Turbo option. Similarly, if the price reaches the lower band of the BB and the RSI touches the oversold region, this shows a potential buy setup.
BOTTOM LINE
The Bollinger Bands and Relative Strength Index strategy is one with numerous advantages. There are some common misconceptions, but it should be successful if you employ proper trading practices.