How to Spot Price Breakouts on Quotex and What to Do When They Happen

Master the art of breakout trading on Quotex. Identify price breakouts from support/resistance and start taking profitable actions today.
-

- 9 min read
Support and resistance levels are key when online trading on Quotex. To be a successful trader, you should be able to identify when the price wants to break out from support/resistance on Quotex and the actions to take when this happens. In this article, you’ll learn how.
WHAT IS QUOTEX?
Quotex is an internet-based brokerage firm that enables you to trade various types of assets. These assets include 26 currency pairs, commodities such as gold and silver, a wide range of stocks, and various cryptocurrencies.
Quotex provides several options for depositing funds, including bank cards, e-payments, cryptocurrencies, and bank transfers. It is important to note that the company does not charge any fees for depositing or withdrawing funds from your account. You can open a real account with Quotex with as little as 10 USD.
Furthermore, Quotex offers different deposit bonuses based on your deposit amount, which can go up to 35% of your deposit. These bonuses are entirely optional and not mandatory.
Regarding the platform, Quotex has implemented advanced technology to deliver a user-friendly interface with appealing visuals. The platform has a customer support system available 24/7 and can assist users in multiple languages, ensuring prompt help for any issues you might encounter.
In addition, if you are new to online trading and want to explore strategies and become familiar with the platform, Quotex provides a risk-free demo account. This demo account offers a secure environment where you can learn and build confidence in trading.
BENEFITS OF BREAKOUT PRICE ACTION ON QUOTEX
There are many benefits of trading support and resistance breakouts on Quotex.
Limited risk: Breakout trades frequently occur when markets are consolidating, enabling the use of small initial stop losses and quick exits if the trade doesn’t work out.
Profit potential: Initiating trades in a strong trend at an early stage can result in substantial profitability.
Trade management: Predetermined entry and exit points in the market help avoid subjective errors when handling open positions.
Trend alignment: Breakout trading seeks to align with an emerging trend, reducing the risk of trading against it.
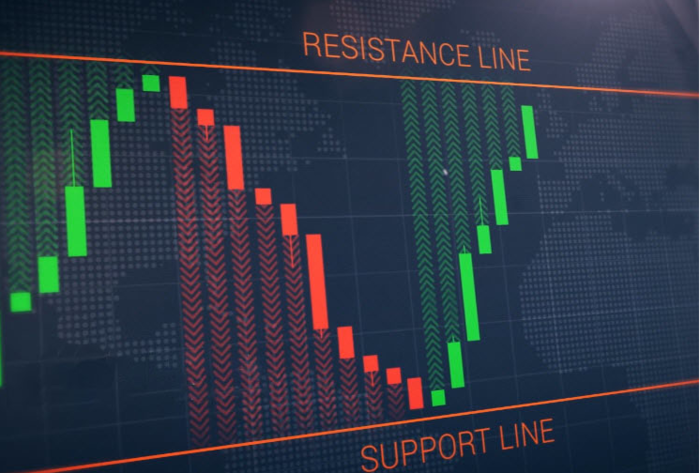
RESISTANCE LEVELS
Now let’s look more closely at resistance levels.
Definition of Resistance Levels
Resistance, and its counterpart known as support, are fundamental aspects of technical analysis. Resistance refers to a price or price range located above the current market that hinders the upward movement of an asset. Over time, resistance indicates selling interest, impeding further progress in price increases.
Resistance can take the form of a specific price point, such as the highest price reached during the day or each hour. It can also be a broader range spanning several points, for example from $0.50 to $1.00.
A resistance zone represents a testing ground for the resistance level, which a small margin might momentarily breach. Still, it ultimately causes the price to retreat, thereby preserving the integrity of the resistance level. Moreover, a resistance zone could suggest the existence of additional supply around that range, potentially indicating a reversal toward lower prices.
You can identify resistance levels in various time frames of chart analysis. Longer time frames, such as daily or weekly charts, tend to reveal more significant resistance levels that may persist over multiple days. Conversely, shorter-term charts like hourly or 30-minute intervals may only display minor resistance levels, which can be useful for day traders.
How Resistance Levels Work
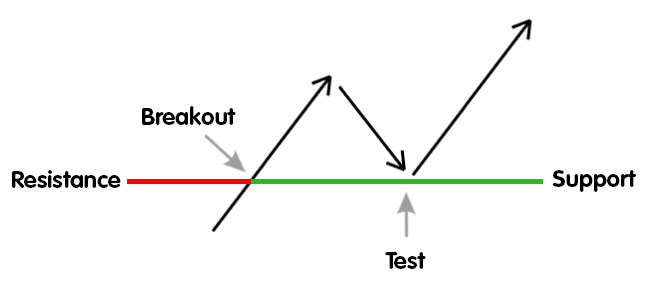
You can use technical analysis to identify a specific level or area of resistance. During an uptrend, this resistance zone is likely to be tested. If the trend and buying interest are strong enough to challenge the resistance level, you may find that the resistance area is broken, leading to an influx of breakout buyers.
Additionally, stop-loss buy orders placed above the resistance area can contribute to the buying pressure and result in a clear breakthrough above the resistance.
Once the price surpasses a resistance point, it is common to see sellers briefly test the lower level to confirm its strength. If the level holds, you will likely interpret the resistance break as valid and expect further upward movement.
This phenomenon is known as the Polarity Principle, where a broken resistance level transforms into a support level and vice versa. The significance of this support, whether major or minor, depends on the time frame of the resistance. Breaking above a recent daily high is more bullish than breaking an hourly resistance point.
Identify a Resistance Level in Quotex
Here is how you can identify a resistance level on Quotex.
To gain insights, analyze price charts on a charting platform or software. Observe the historical price data for your desired asset and identify recurring points of resistance where the price consistently fails to ascend further.
You can find horizontal price levels by identifying historical areas where the asset’s price has encountered strong selling pressure and failed to surpass. These levels create a horizontal line on the chart.
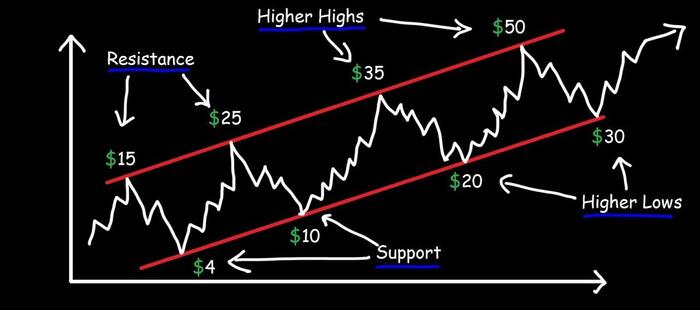
Identify previous peaks or highs where the price has reversed its upward movement. These levels can act as resistance if the price attempts to move higher again. Locate previous highs.
Observe the trading volume at potential resistance levels and pay attention: higher trading volume near a specific price level indicates increased selling pressure. This increased selling pressure makes it more likely for the price level to act as a resistance level.
Role of Technical Indicators in Identifying a Resistance Level
Technical indicators aid you in identifying levels of resistance on a chart. You can use moving averages, trend lines, MT4 support resistance breakout indicators, Fibonacci retracement, oscillators, and volume indicators.
Strategies to Utilize a Resistance Level
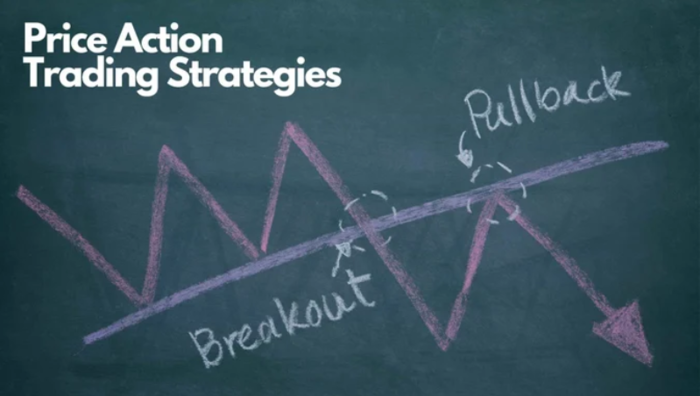
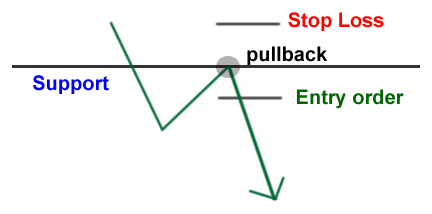
One of the strategies in which you can use support and resistance level is the support resistance breakout.
You can go about this strategy in two ways. First, you can be aggressive about it. This means that the moment the price moves past a resistance or support level, you enter the trade.
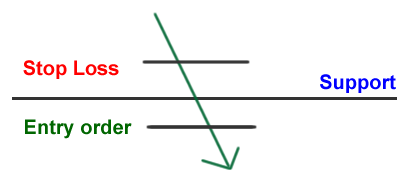
On the other hand, you can take the conserved approach. In this case, you wait for the price to return to the support or resistance level after breaking it. You enter the trade on the pullback.
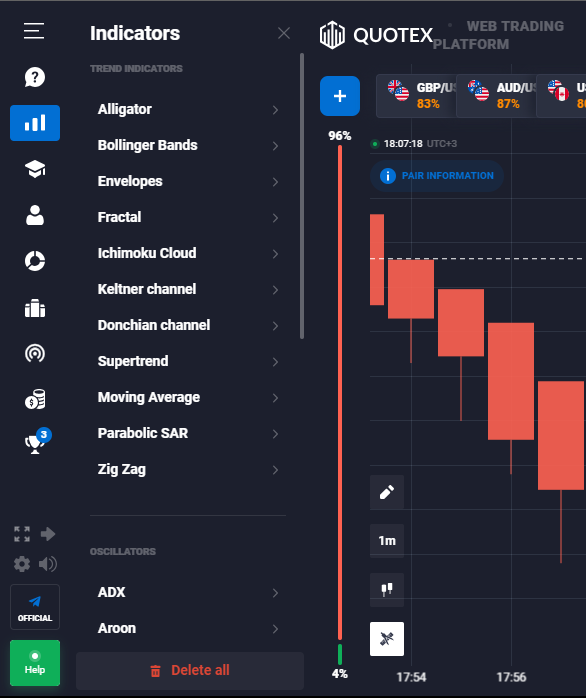
TECHNICAL INDICATORS
Technical indicators are signals generated by analyzing patterns and data related to a security or contract’s price, volume, and open interest. These signals are hands-on and useful to traders who adhere to the principles of technical analysis.
Types of Technical Indicators
Quotex offers various technical indicators to improve your overall trading experience. Some of these indicators are explored below.
Support and Resistance Breakout Arrows for MT4
The Support Resistance Breakout Arrows indicator for MT4 is a support resistance breakout indicator crucial for intraday forex traders employing a support and resistance breakout strategy. This indicator integrates fractal, CCI, and RSI to generate highly effective BUY and SELL arrow signals for forex traders.
Additionally, it automatically plots significant support and resistance levels, enabling you to consider additional positions during robust trends. Importantly, this MetaTrader 4 indicator does not repaint the signal arrows and support/resistance lines, providing reliable and accurate information.
Fibonacci Retracement
Fibonacci retracement levels are horizontal lines indicating potential support and resistance levels where the price may reverse. It’s important to note that the Fibonacci tool is most effective when the market is displaying a clear trend.
When the market trends upward, the strategy involves buying or going long during a retracement at a Fibonacci support level. Conversely, when the market is trending downward, the approach is to sell or go short during a retracement at a Fibonacci resistance level.
Fibonacci retracement levels are a forward-looking technical indicator to anticipate potential future price levels.
Support and Resistance Breakout Scanner
The support and resistance breakout scanner is an automatic scanner that you use to detect price breakouts.
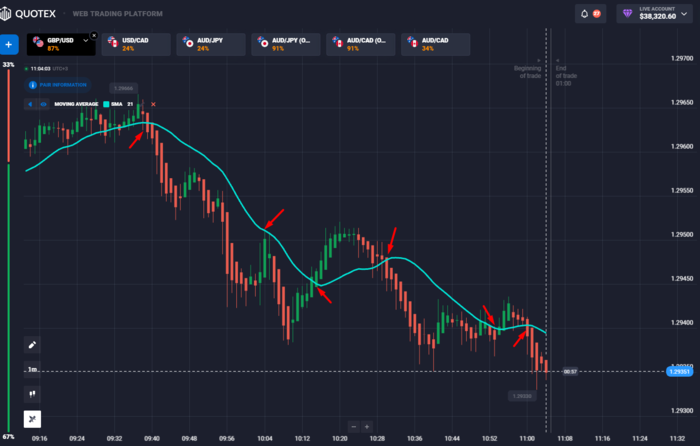
Using Moving Averages as Technical Indicators with Quotex
You can use the moving average to identify support and resistance levels and trends. Let’s take a look at how to accomplish this.
Long-term trends can be determined using various moving averages, such as the 50-day and 200-day moving averages, which help smooth out price fluctuations and visually represent the overall trend.
A potential uptrend occurs when the shorter-term moving average crosses over the longer-term moving average. In contrast, a potential downtrend occurs when the shorter-term moving average crosses under the longer-term moving average.
Looking for support and resistance when trading? Moving averages can be helpful in this area too. In an uptrend, the moving average often acts as support, while in a downtrend, it becomes resistance.
So if you’re looking to buy, keep an eye out for the price bouncing off the moving average during an uptrend. On the other hand, if you’re looking to sell, watch for the price encountering resistance near the moving average during a downtrend.
Other Commonly Used Technical Indicators with Quotex
The other commonly used technical indicators you might meet when interacting with the Quotex platform include the following:
- Ichimoku Cloud
- Fractals
- Envelopes
- Keltner Channel
- Parabolic SAR
- Zig Zag
- Supertrend
- Alligator
FINANCIAL MARKETS AND PRICE ACTION
Price action refers to the fluctuation of a security’s price displayed on a chart over a specific period. It is the foundation for all technical stock, commodity, or asset chart analyses.
Numerous short-term traders depend solely on price action and its patterns and trends to guide their trading choices. As a methodology, technical analysis stems from price action as it utilizes historical prices in calculations that subsequently influence trading decisions.
Understanding Financial Markets and Price Action in Quotex
You can understand price action using time-series charts. You can use different chart compositions to improve your ability to recognize and comprehend trends, breakouts, and reversals. Candlestick charts are popular because they enable you to better visualize price movements by showing the open, high, low, and close values in the context of up or down sessions.
The Harami cross, engulfing pattern, and three white soldiers exemplify visually interpreted price action. Due to price activity, many additional candlestick formations predict what will happen next. You can apply these same forms to point and figure charts, box charts, and box plots.
Experienced Traders and Market Conditions
Experienced traders are generally successful because they have an established trading plan and a proper risk management plan.
BOTTOM LINE
Support and resistance levels are crucial when online trading. You can incorporate these levels in breakout strategies where you use indicators to identify these levels.