Trading Inside Bar Patterns on Quotex: A Comprehensive Guide
Learn how to identify and profitably trade inside bar patterns on Quotex. Discover the advantages, technical indicators, and money management strategies for successful trading.
-
 Saqib Iqbal
-
 Liz Kazandzhy
- 10 min read
Trading inside bar patterns on Quotex is easy. Below, we will show you how to identify these patterns on Quotex and trade them profitably.
WHAT IS AN INSIDE BAR PATTERN?
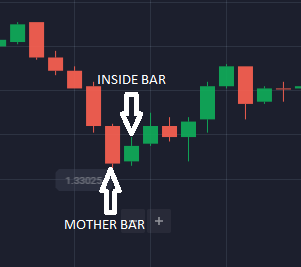
The “inside bar” pattern is a trading strategy based on two bars of price action. In this pattern, the second bar (known as the inside bar) is smaller and contained within the high and low range of the previous bar (referred to as the “mother bar”).
Therefore, the high of the inside bar is lower than the high of the mother bar, and the low of the inside bar is higher than that of the mother bar. The inside bar can form at the mother bar’s top, middle, or bottom.
There’s an even more flexible definition of the inside bar, allowing for equal highs or lows between the inside and mother bars. Nevertheless, if both bars have the same high and low, most traders do not consider it an inside bar.
Inside bars indicate a period of consolidation in the market. On a daily chart, an inside bar resembles a “triangle” shape on shorter time frames like 1 hour or 30 minutes. These patterns often form after a significant market movement, serving as a pause for consolidation before the next move.
However, they can also emerge at market turning points, signaling potential reversals from key support or resistance levels.

Advantages of Trading Inside Bars on Quotex
Trading the inside bar can prove rather advantageous to many traders. Here are some of the benefits you can experience.
- It is simple to identify and comprehend inside bars. This pattern, comprised of just two bars, is uncomplicated and can be easily recognized and acted upon by traders of all experience levels.
- Inside bars offer clear entry and stop-loss levels, allowing for a well-defined risk management strategy. When the market breaks out toward the inside bar, you can enter a trade and place a stop-loss order just beyond the high or low of the inside bar.
- Trading inside bars allows you to enter the market with reduced risk. Inside bars are a sign of consolidation or indecision in the market, offering a period of stability. This contrasts with strong trending conditions, where the market can be more volatile and unpredictable, increasing the risk for traders.
- Due to the possibility of profitable trades over the long term, inside bar trading provides a favorable reward-to-risk ratio. The clear stop-loss placement allows for a smaller risk taken, potentially leading to an even larger potential profit.
- Traders can apply inside bars to various markets and time frames, from intraday trading to swing trading and even longer-term investing. This adaptability allows traders to customize the strategy to fit their trading style and time limitations.
- After a significant trend, when an inside bar pops up, the trend might take a breather or even reverse. This is especially true if the inside bar forms a crucial support or resistance level. Such occurrences serve as confirmation signals for potential price reversals.
- You can use inside bars with other technical indicators to increase your chances of getting profitable trades. Inside bars allow you to incorporate numerous technical indicators, including trendlines, moving averages, and other chart patterns.
IDENTIFYING AN INSIDE BAR PATTERN
Let’s look at how to identify inside bar patterns when trading on Quotex.
Learn the Parameters of an Inside Bar
To identify the inside bar pattern, you first need to learn its parameters.
- The two-bar pattern involves two consecutive bars on a price chart.
- The inside bar must be smaller than the mother bar in terms of its range and overall size.
- The size comparison should encompass the entirety of the inside bar inside the mother bar. To be clearer, the mother bar’s high must be higher than the inside bar, and the inside bar’s low must be raised marginally compared to the low of the mother bar.
- The inside bar can appear at the mother bar’s top, middle, or bottom.
Analyze the Price Action and the Support and Resistance Levels
Price action refers to the price movement of a financial instrument depicted on a chart over a specific period. It is the foundation for conducting technical analyses on stocks, commodities, and other assets.
Experienced traders depend on price action to deduce patterns and trends crucial to their trading choices. As a methodology, technical analysis originates from price action as it involves utilizing historical prices in calculations that subsequently guide trading decisions.
The inside bar pattern is an important aspect of price action analysis because it provides valuable information about market sentiment and potential future price movements.
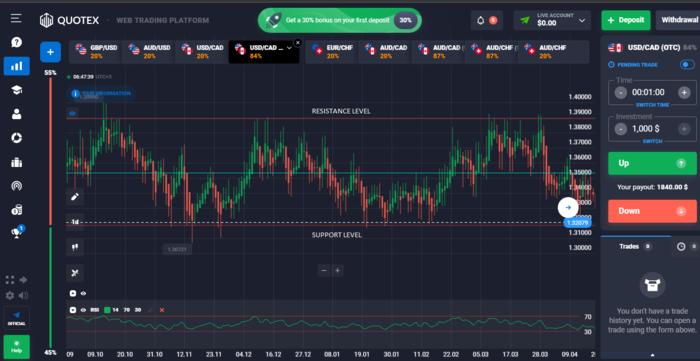
Support and resistance levels are crucial concepts in technical analysis. In a downtrend, prices fall due to excess supply over demand until a level where demand matches supply, creating support. Support can be a price level or a zone where buyers are willing to buy, causing price declines to stop and reverse.
Conversely, in an uptrend, prices rise because of more demand than supply until selling overwhelms buying, forming resistance. Identifying these levels allows traders to make informed entry and exit decisions based on price behavior, either bouncing away from or breaking through these support and resistance zones.
When an inside bar pattern forms near a support or resistance, it can mean a lot of different things. For example, consider these possibilities.
Breakout signal: An inside bar occurring on support and resistance may indicate a breakout opportunity. This could indicate potential indecision in the market. To verify the inside bar pattern, look for breaks in the direction of the overall trend. A rise above the resistance level or a fall below the support level would indicate a continued direction of travel.
Reversal signal: Sometimes a significant inside bar near a significant support or resistance level may indicate a potential trend reversal. Traders will often seek a breakout in the opposite direction of the prevailing trend to consider a potential trade reversal.
Consolidation signal: The inside bar pattern indicates a period of consolidation — this period is significant when occurring near a support or resistance level. This would suggest that market participants are still determining the asset’s future course.
Utilizing Technical Indicators with Your Chart Setup
You can also use technical indicators when trading inside bar patterns. Here’s how.
Moving Averages: You can use moving averages as moving support and resistance levels. If you spot a bullish inside bar formation over a rising 50-moving average, it indicates that the price will continue in an uptrend.
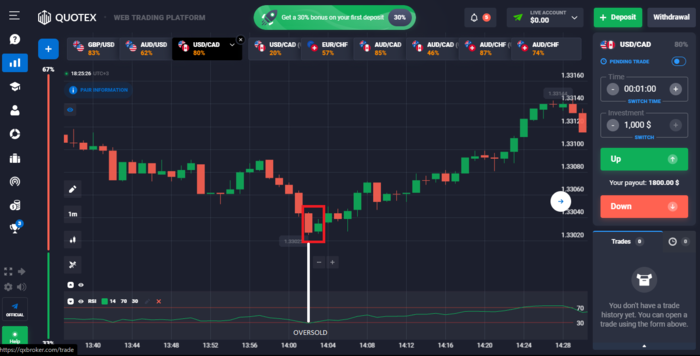
Relative Strength Index (RSI): The RSI can inform you of oversold and overbought market conditions. When it goes over 70, then the market is overbought. If it goes under 30, then the market is oversold. Combining inside bar patterns and the RSI can help you identify where the market reverses or where a trend might continue.
Moving Average Convergence Divergence (MACD): MACD is a momentum indicator that follows the trend. Watch for when it diverges or converges within the price action of inside bars. This can give you additional trade setups for potential trades.
Volume Analysis: You can use volume indicators to monitor the volume around inside bars. When you spot a breakout in an inside bar, the increasing market volume can help you confirm its success.
Read and Interpret Candlestick Analysis

Reading and interpreting candlestick analysis is important when trading inside bar candlestick patterns. Let’s take a look at how to do this.
Understanding inside bars: First, you need to understand the inside bar. It occurs when the previous candlestick completely consumes the range of one candlestick. This pattern reflects a period of consolidation in the market.
Size of the inside bar: The size of the inside bar also matters. Smaller inside bars indicate tighter consolidation, while larger ones may suggest more significant potential price movements.
Market context: Consider the broader market context before interpreting an inside bar. For example, consider if you’re in a trending market or a range-bound market. Understanding the market zone can help you better understand the inside bar’s significance.
Support and resistance levels: Identify key resistance and support levels. Inside bars that form at these levels usually provide ideal trade opportunities. It’s usually a good idea to trade inside bar breakouts below support or above resistance.
Bullish and bearish inside bars: A bullish inside bar forms when the current bar’s high is lower than the previous bar’s high and the low is higher than the previous bar’s low. Conversely, a bearish inside bar forms when the current bar’s high is lower than the previous bar’s high and the low is higher than the previous bar’s low.
Confirmation: Inside bars are neutral. They do not provide information on the direction of the market. You can increase your success rate by looking for confirmation signals, such as a breakout of the high or low of the inside bar. A bullish breakout confirms a potential uptrend, while a bearish breakout confirms a potential downtrend.
Understand Money Management Strategies
Money management is important since it involves controlling how much you use and risk per trade. Here are some money management techniques you should use when trading the inside bar pattern.
Position sizing: Select the appropriate position size for each transaction based on your degree of risk tolerance and the volume of your financial account. A general rule of thumb is to only risk a small portion of your capital in trading, such as 1% or 2%. On any single transaction, you risk this percentage. This prevents a succession of poor trades from significantly diminishing your account.
Risk-reward ratio: Consider the risk-reward ratio before committing to a trade. Figure out your potential target (reward) and the distance to your stop-loss threshold (risk). A favorable risk-reward ratio, such as 1:2 or higher, implies that your potential profit is at least twice the amount you risk.
Stop-loss orders: Constantly utilize stop-loss orders to reduce your potential loss. For interior bar setups, place your stop-loss below the low of a bullish interior bar breakout or above the high of a bearish interior bar breakout.
TRADING INSIDE BAR PATTERNS ON QUOTEX
Below, we will take a look at how to trade inside bar patterns on Quotex.
Set Up Your Trade Entry
You can trade inside bars in Quotex in two ways based on the market’s prevailing trend. When you trade in the direction of the trend, it is commonly known as a “breakout play.” On the other hand, when you trade against the trend, typically from significant chart levels, it is often referred to as inside bar reversals.
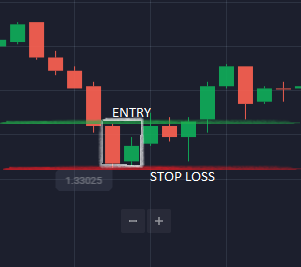
The standard approach for entering a trade based on an inside bar signal is to set a buy stop or sell stop at the high or low of the mother bar. Quotex will execute the entry order once the price breaks above or below the mother bar.
Regarding stop-loss placement, it is customary to position it at the opposite end of the mother bar. Alternatively, it can be placed near the halfway point (50% level) of the mother bar, especially if its size is larger than usual.
BOTTOM LINE
Trading the inside bar in Quotex requires that you understand the parameters of the pattern well. You can then follow the steps provided to execute a proper trade.