How to Trade with the Momentum Indicator on Quotex
Unearth powerful trading strategies with Quotex’s Momentum Indicator. Navigate market trends and optimize your trades effectively.
Have you wondered what online trading is all about? Do you ever wonder how some traders consistently make smart, calculated decisions and stay ahead of the curve?
You might be surprised to learn about the Momentum Indicator on Quotex — a powerful tool that could drastically improve your trading.
WHAT IS THE MOMENTUM INDICATOR?
An indicator of momentum measures how fast or how much a financial instrument’s price changes, such as stocks, commodities, or digital options. Traders use it to visualize a specific price movement’s speed or strength using technical analysis tools.
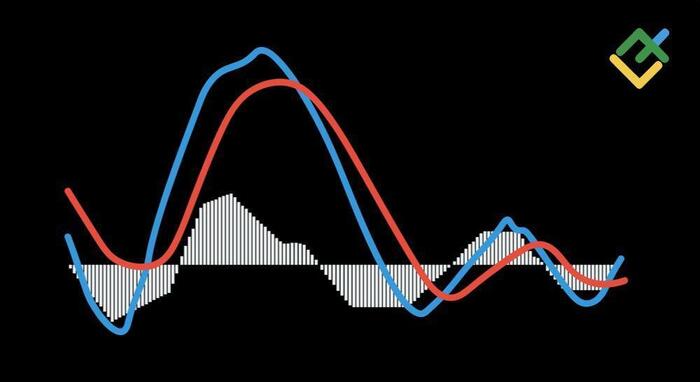
Quotex is a platform known for its user-friendly interface and comprehensive trading tools. Its Momentum Indicator appears as a separate line beneath the main price chart. Traders can determine potential buy or sell signals based on the direction of the Momentum Indicator line.
Rising lines indicate increasing momentum, suggesting a good time for a purchase. Falling lines, on the other hand, indicate declining momentum, which may mean a good time to sell.
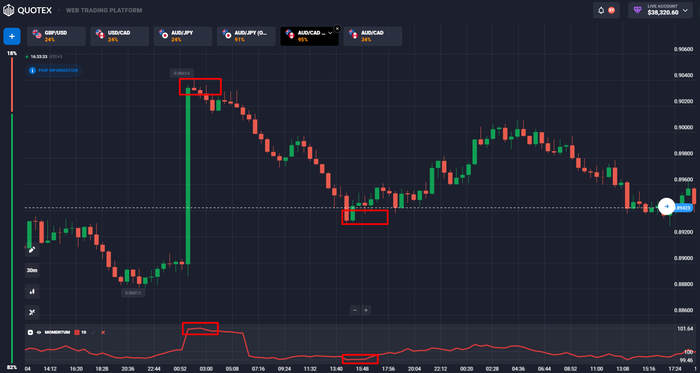
The Momentum Indicator is also useful for identifying overbought and oversold conditions. Indicators can indicate overbought markets if they reach extremely high values before declining, signaling a time to sell. The Momentum Indicator may also indicate a potential buying opportunity if it reads an extremely low value and then begins to climb.
WHY USE THE MOMENTUM INDICATOR ON QUOTEX
The Momentum Indicator is one of the most popular technical analysis tools among Quotex users for several reasons.
Ease of Use
Quotex’s Momentum Indicator, which is easily accessible and simple to use, fits seamlessly into the platform. Due to its user-friendly interface, you can quickly understand and apply Quotex, even if you’re a beginner.
Improved Decision Making
Quotex measures the strength of the market trend based on the Momentum Indicator. You can time your trades better by showing when momentum increases or decreases. The market trend is like a “wind vane”!
Risk Management
Momentum Indicators can also act as early warning systems. It could signify a future price reversal if the momentum decreases while the price rises. You can protect your investments and manage your risk this way.
Profit Maximization
The Momentum Indicator alerts traders when prices are overbought or oversold to maximize their profit potential.
With the Momentum Indicator, many users have significantly improved the precision and calculation of their trading decisions. Quotex’s Momentum Indicator can help you get closer to your trading goals by helping you make the right trades at the right time.
TECHNICAL ANALYSIS TOOLS AND INDICATORS
Can you imagine what trading would be like if you had a crystal ball that could predict market trends? Although we don’t have a magical crystal ball in the trading world, we have some tools and indicators to help us make predictions.
Quotex offers a range of these robust tools and indicators within its platform. They enable traders to make calculated and informed decisions by providing valuable insights into market trends. They take your trading game to a whole new level of strategic planning by predicting potential price movements in the future.
What Are Technical Analysis Tools and Indicators?
Indicators and technical analysis tools facilitate the interpretation of market data and the forecasting of future prices. Several of these tools are available on the Quotex platform, offering unique insights into the market dynamics.
Candlestick Charts
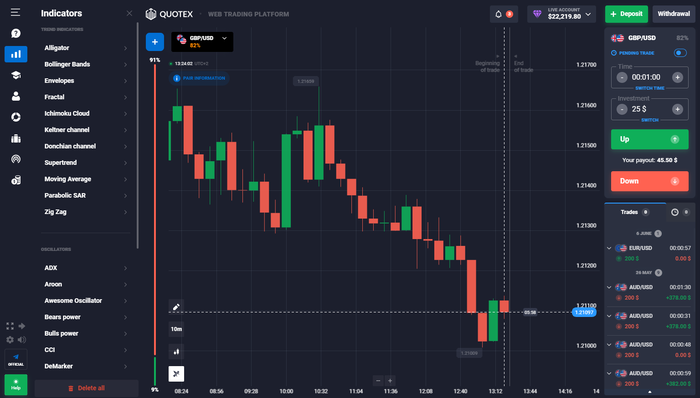
On Quotex, the candlestick chart is a popular tool. This tool visualizes price movement vividly, displaying opening, closing, high, and low prices for each candlestick corresponding to specific time frames. Having a screen full of the market’s journey is like having a storybook, helping you make more informed trading decisions.
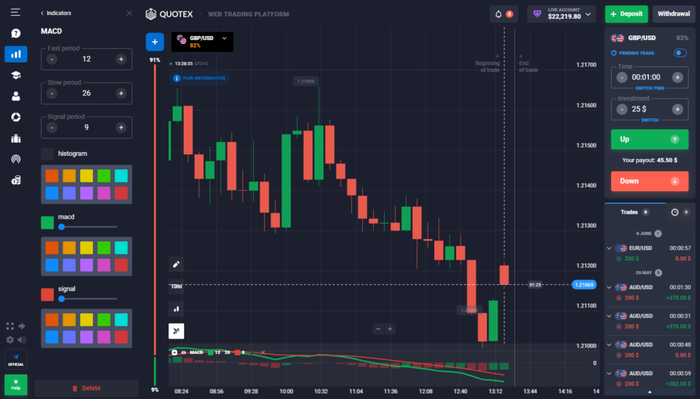
Moving Averages
On Quotex, you’ll also find the moving averages tool. This method highlights long-term trends or cycles by eliminating short-term market fluctuations. Moving averages allow you to identify potential market trends and position your trades accordingly.
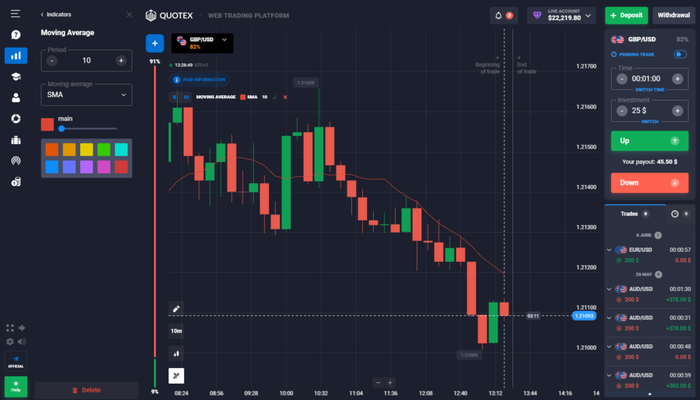
Bollinger Bands
Bollinger Bands are one of the unique features of Quotex. This tool has three bands: a middle band, two outer bands, and an outer band, determining whether a market is overbought or oversold. A dynamic market perspective is provided by the widening or narrowing of these bands as volatility increases or decreases.
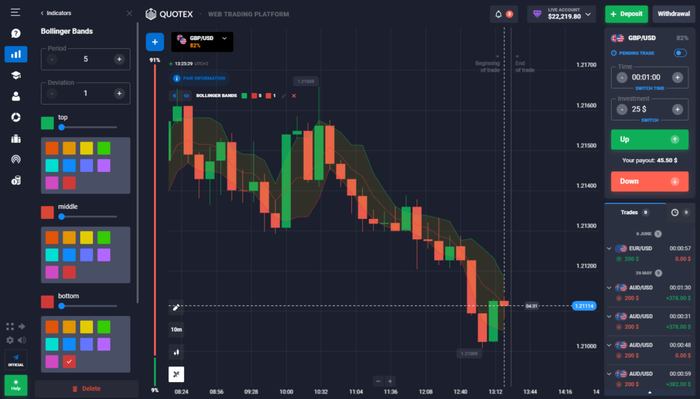
Popular Trading Indicators Used on Quotex
The Quotex platform offers an array of trading indicators for guiding your trading decisions. There are several popular ones, including the following.
Relative Strength Index (RSI)
The Relative Strength Index (RSI) is one of the most popular indicators on Quotex. The indicator oscillates between 0 and 100, measuring how fast and how much the price moves. If the RSI is above 70, it suggests that the market is overbought. If the RSI is below 30, it may indicate that the market is oversold. I use the RSI to detect potential reversals early to enhance my trade efficiency.
Moving Average Convergence Divergence (MACD)
On Quotex, you can also use the MACD indicator. It is an indicator that shows the relationship between two moving averages of the price of an asset. A trend indicator allows traders to enter and exit well-timed trades by indicating the onset of a trend.
Momentum Indicator
Using Quotex’s Momentum Indicator, you can measure the rate at which prices change. In particular, this indicator helps traders identify potential entry and exit points for their trades on Quotex.
Setting up Your Tradi̇ng Platform to Use the Momentum Indicator
Here is a step-by-step guide to setting up the Momentum Indicator tool on Quotex.
Step 1: Open the Quotex Platform
The first step is to log in to your Quotex account. After you log in, you’ll see the main trading interface. The chart shows the price movement of your chosen asset.
Step 2: Navigate to the Indicators Menu
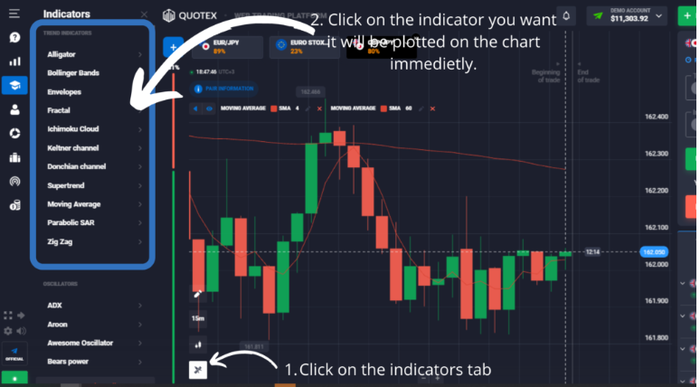
You’ll find a variety of buttons on the top of the platform. Select the “Indicators” option. When you click this, a drop-down menu will appear containing all the technical analysis indicators Quotex offers.
Step 3: Select the Momentum Indicator
Make your way down the list until you find “Momentum.” Adding the Momentum Indicator to your trading chart is as simple as clicking on it. Quotex shows it in the line beneath the main price graph.
Step 4: Adjust the Settings
You can now customize your trading strategy with the Momentum Indicator. Change the settings of the Momentum Indicator by clicking the “Settings” icon. In this section, you can set the period, which determines how many periods the indicator will take into account when calculating. Short-term traders typically trade for ten days, but you can adjust it accordingly.
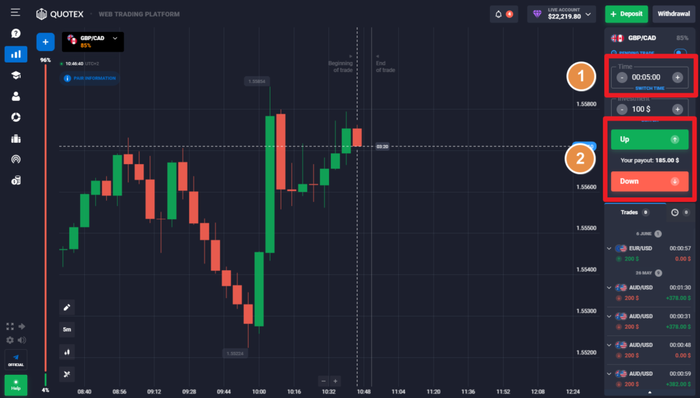
Step 5: Start Using the Momentum Indicator
You can now use the Momentum Indicator to help you make trading decisions with your Quotex trading platform. When the Momentum Indicator line rises, the price may gain momentum, possibly indicating a good time to buy. It is time to sell when the line falls because the price is losing momentum.
Use the Momentum Indicator and other technical analysis indicators and tools for the best results. In trading, strategy is everything, and the right tools can make all the difference. Now you can take on the exciting trading world using the Momentum Indicator on Quotex!
UNDERSTANDING PRICE CHARTS AND PRICE MOVEMENTS
It’s important to consider price charts and movements to develop a successful trading strategy. Quotex allows users to analyze multiple charts, watching the price increase and noting patterns and trends that tell a market’s story. The key to successful trading is understanding this story.
Price charts on Quotex are powerful because they are simple. These charts present price movements over a particular period. These tools can assist you in identifying trends, identifying trade opportunities, and projecting future price movements. Taking a closer look at this will help us better understand it.
What Is a Price Chart?
The price chart shows the price movement within a market over a given period. The chart shows the market’s heart, shows how prices have moved previously, and predicts future movements.
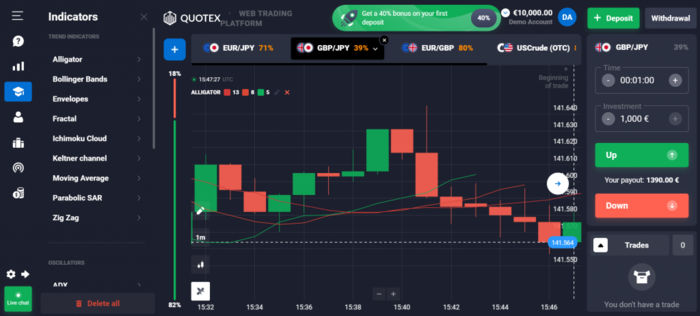
You’ll find several price charts on Quotex, including line charts, bar charts, and candlestick charts. The purpose of each chart is the same as any other tool in the platform: to assist you in making informed trading decisions based on the price data.
How to Interpret Price Movements with the Momentum Indicator
With Quotex’s Momentum Indicator, traders can interpret price movements in a whole new way. Here are step-by-step instructions on how to do this.
Step 1: Set Up the Momentum Indicator
Please set up your Momentum Indicator on Quotex by following the earlier steps. Ensure you customize it following your trading strategy.
Step 2: Understand the Momentum Indicator Line
Momentum Indicators on Quotex appear beneath your main price chart. The price of your asset will gain momentum if this line rises. In contrast, a falling line indicates that momentum is eroding.
Step 3: Make Informed Trading Decisions
These momentum shifts can inform trading decisions. You should consider buying if the Momentum Indicator line rises. The best time to sell is usually when it’s falling.
Using Resistance Levels to Help Identify Trends and Support Points
On Quotex, you can also use resistance levels and support points on your trading journey. Let’s take a brief look at how to accomplish this.
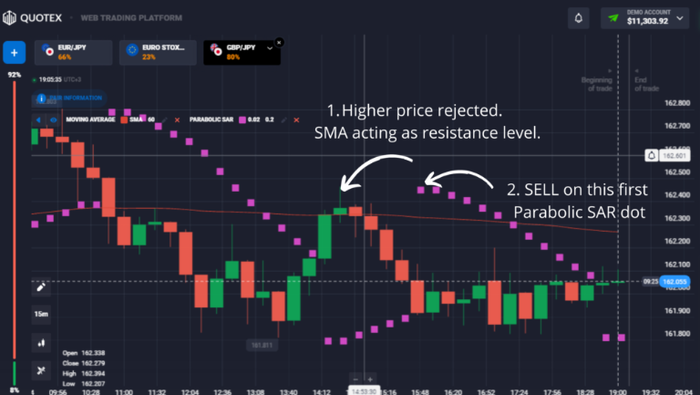
Step 1: Identify Resistance Levels and Support Points on the Chart
You can use your Quotex price chart to find areas where the price has bounced back after rising or falling (resistance levels). Before this year, the price has struggled to break through in these areas.
Step 2: Draw Horizontal Lines at These Levels
Draw horizontal lines between these levels on your Quotex chart to help you identify them. You can visualize support and resistance areas using these lines.
Step 3: Use These Levels to Inform Your Trading Decisions
By identifying these levels, you can make better trading decisions on Quotex. The price might break through a resistance level if it approaches it with rising momentum, indicating a good buying opportunity.
Trading can seem overwhelming for new traders, especially when trying to understand and interpret price charts. Practice and patience will help you master these skills. Then you’ll discover they’re indispensable tools for Quotex trading. Embrace the charts and let the price guide your path!
TIME FRAME CONSIDERATIONS WHEN TRADING WITH THE MOMENTUM INDICATOR ON QUOTEX
When it comes to trading, time is a very important factor. When using technical indicators such as the Momentum Indicator on Quotex, your choice of time frame affects the overall market perspective and plays a significant role. Choosing the right time frame can be the difference between successful and unsuccessful trades.
What Is the Time Frame for Trading?
The first thing we need to understand about time frames is what they are. A time frame refers to when a trade occurs on a price chart. On Quotex, you can choose time frames ranging from one minute to one month. Each time frame displays a different number of price bars or candlesticks depending on the period you choose.
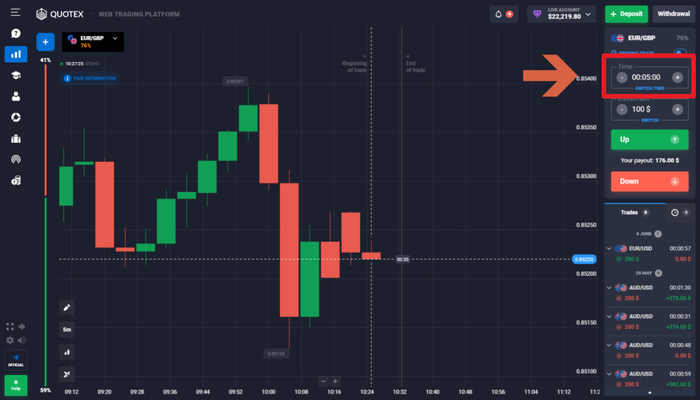
Your trading strategy depends heavily on the time frame you choose. Short-term traders, such as day traders or scalpers, may prefer smaller time frames (1-minute and 5-minute charts) to capture profits quickly. However, long-term traders (such as swing traders and investors) may select larger time frames to identify broader market trends.
Now let’s turn our attention to the Momentum Indicator. Using this technical indicator, you can determine the rate of price change over a given period. Therefore, your time frame will influence the calculation and how the Momentum Indicator provides insights.
For example, let’s say your Momentum Indicator period is 10. In this case, the Momentum Indicator will consider price changes over the last 10 minutes on a 1-minute chart on Quotex. When it comes to a 1-day chart, it incorporates the price changes over the last 10 days. This setting can make a huge difference in your trading decisions.
It would help to consider your trading strategy, style, and risk tolerance to choose the most appropriate time frame when using the Momentum Indicator on Quotex. There’s no single time frame that’s the best for everyone or all circumstances. It is important to align your trading strategies and goals with the best time frame for you and your goals. A successful trader needs the flexibility and tools to personalize their trading, and Quotex provides those tools.
PROFITABLE TRADES USING THE MOMENTUM INDICATOR ON QUOTEX
Would you like to make some money trading on Quotex? With the Momentum Indicator, you can identify conditions of overbought and oversold conditions as well as potential trend reversals. Here’s how you can do it.
How to Find Profitable Trades Using the Momentum Indicator on Quotex
Following are some steps you can take to find profitable trades on Quotex using the Momentum Indicator:
- Choose a currency pair that you want to trade.
- Select the Momentum Indicator from the list of available indicators.
- Set the period for the Momentum Indicator. The most common settings are 7, 14, and 21 periods.
- Look for a currency pair that is overbought or oversold. The Momentum Indicator will show this by crossing above or below the 70 or 30 levels.
- Wait for a reversal signal. The Momentum Indicator will give a reversal signal when it crosses above or below the 70 or 30 levels.
- Place a trade in the direction of the reversal signal.
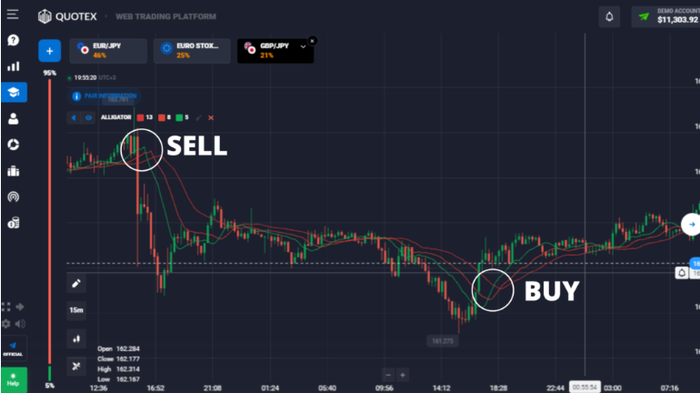
Say, for instance, you trade EUR/USD. The Momentum Indicator currently indicates that the market has reached overbought levels. In other words, the price is likely to reverse if it climbs slowly. A cross below 70 on the Momentum Indicator indicates a market reversal. You can place a sell order when it exceeds the 70 level.
Analyzing Currency Pai̇rs to Make Profitable Trades Wi̇th the Momentum Indi̇cator on Quotex
Keep the following things in mind when using the Momentum Indicator on Quotex to analyze currency pairs.
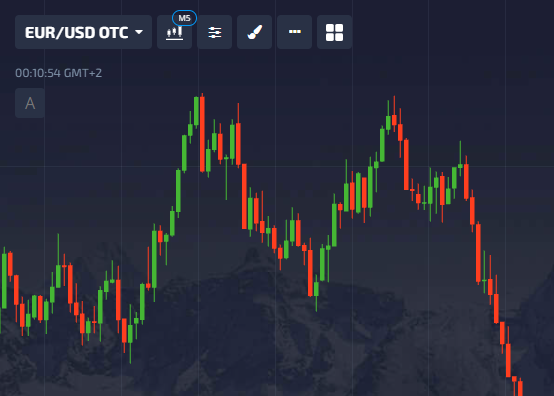
- Choose the right currency pair. There is no one-size-fits-all when it comes to currency pairs. A currency pair with a high trading volume and liquidity is more likely to experience reversals than a pair that doesn’t have a high trading volume and is more volatile.
- Set the right period for the Momentum Indicator. It would be best to experiment with different periods to determine what works best for you regarding the Momentum Indicator. A shorter period will be more sensitive to price movements, whereas a longer period will be less sensitive.
- Look for overbought and oversold conditions. Overbought and oversold conditions may indicate that the market is about to reverse and can be detected by the Momentum Indicator.
- Wait for a reversal signal. The Momentum Indicator gives a reversal signal when it crosses above or below 70 or 30 levels, depending on whether the market is overbought or oversold.
- Place a trade in the direction of the reversal signal. As soon as you receive a reversal signal, you can place a trade in the direction of the reversal. For example, trade toward the reversal if you receive a sell signal.
On Quotex, you can find profitable trades using the Momentum Indicator by following these steps.
BOTTOM LINE
Indicators such as the Momentum Indicator can be very useful in finding profitable trading opportunities on Quotex. Like with all things related to trading, be sure that your strategy includes market research and proper risk management.


