Quotex Trading Mastery: Dive Into the SMA, RSI, and MACD Indicators
Learn how to use Quotex’s powerful trading tools — SMAs, RSIs, and MACDs. Boost your trading performance by improving your strategies and decoding market signals.
-
 Saqib Iqbal
-
 Liz Kazandzhy
- 9 min read
Finding a trading platform that suits your needs, developing a strategy, and understanding the markets can be an exciting journey for a trader. Trading platforms like Quotex provide a wide range of trading tools, including Simple Moving Averages (SMAs), Relative Strength Indexes (RSIs), and Moving Average Convergence Divergences (MACDs).
Is it possible to combine them to develop a robust trading strategy? How does Quotex facilitate their use? We will explore these questions and others throughout this comprehensive article.
WHAT IS QUOTEX?
With Quotex, you can invest in over 100 markets using digital options. As of 2020, Maxbit LLC (owner) manages the platform at First St Vincent Bank LTD Building, James Street, Kingstown, St. Vincent and the Grenadines. As of today, the company has its headquarters in St. Vincent and the Grenadines.
This broker accepts all kinds of clients and is typical of an offshore broker. It is possible to trade the markets and get a high yield of up to 95%, giving you the chance to earn a significant amount of money through the platform.
You can simplify trading and analyze your trading performance using charts like the SMA, RSI, and MACD. Quotex presents a newly developed trading platform and software that allows you to navigate market trends and make informed trading decisions based on these technical indicators.
In addition to being available for desktop and mobile devices, Quotex is open in more than 20 countries, and the company offers support services in several different languages. Because the broker is relatively new, there is still little information on the internet about it, but traders have been very impressed by the platform. It offers a lot of opportunities to clients and investors alike.
Why Connect the SMA, RSI, and MACD?
Let’s take a look at these popular indicators and how they can be used together.
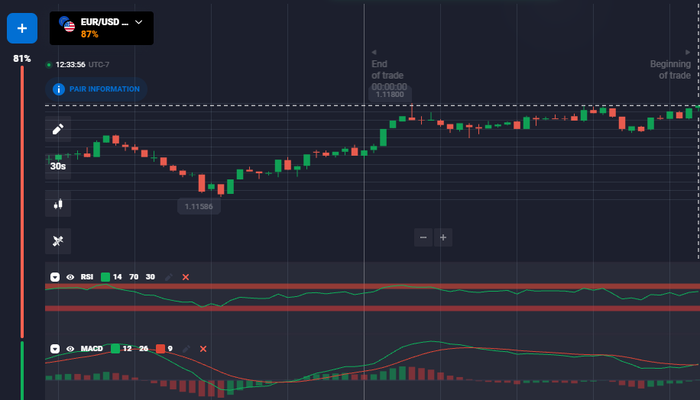
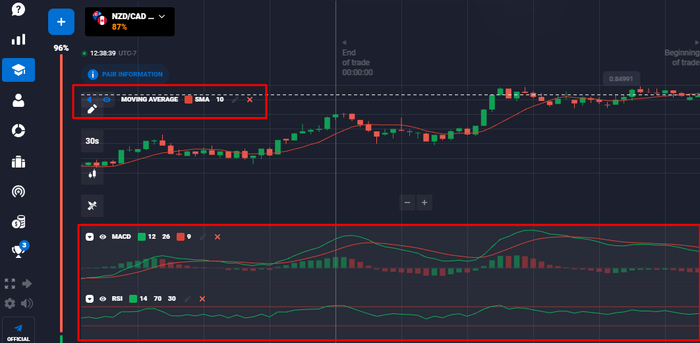
A trader follows the RSI line and looks to see when it crosses the 50 level. The SMA indicates whether the price has exceeded the average for an extended period. The MACD is the second filter we use in our strategy. When it crosses the baseline, it provides strong signals. Check if the price bars form under or over the SMA line.
Combining three indicators produces more accurate signals than using each indicator individually. You can apply it to multiple types of assets available on the trading platform.
Traders may find it difficult to wait for all three indicators to align, which may not suit their trading style. As with any trading strategy, false signals can result in unsuccessful trades. Before traders can use the three indicators effectively, they must understand how each works.
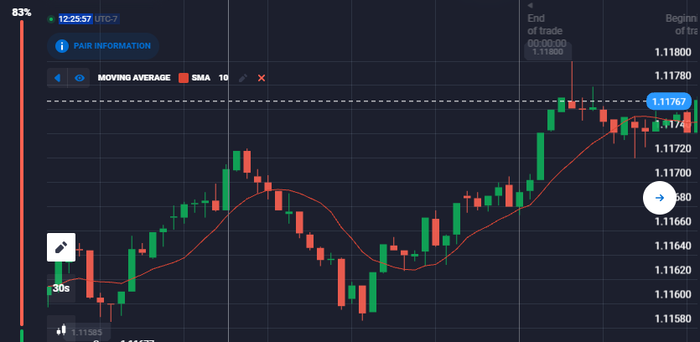
SIMPLE MOVING AVERAGE (SMA)
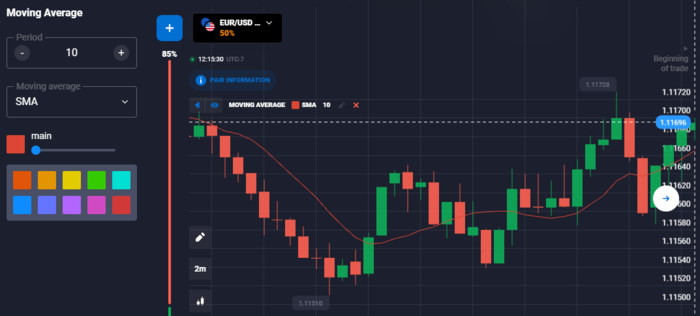
Using a Simple Moving Average (SMA), you can predict the price of an asset. Like any trend-following indicator, you can use it to determine if an asset’s price will rise or fall. You will see a line drawn on the charts immediately after adding the SMA to Quotex. The SMA is a line drawn on the chart that visually indicates the direction of the price movement.
How to Calculate the SMA
To calculate a Simple Moving Average (SMA), you can follow these steps:
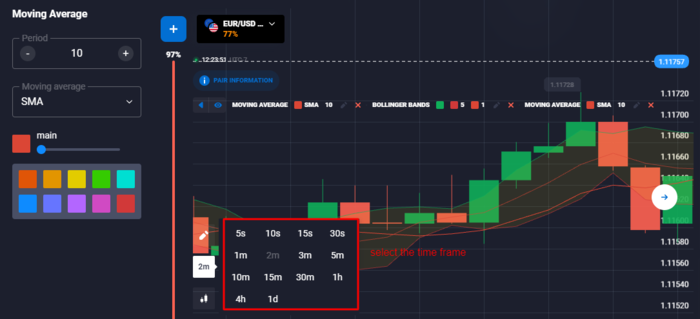
Select the time frame: First, choose the period for calculating the SMA. Depending on your trading strategy and the asset you are trading, the period may range from a few minutes to several days or months.
Gather the closing prices: As soon as you’ve established a time frame, gather the closing prices within that period. For example, if you’re finding the moving average over the previous 20 days, you’ll need the closing prices for the 20 days prior.
Add the closing prices: The next step is to summarize the closing prices from the previous two periods.
Calculate the average: You must divide the total you obtained in step 3 by the number of periods. This is especially important if you’re calculating an SMA for 20 days.
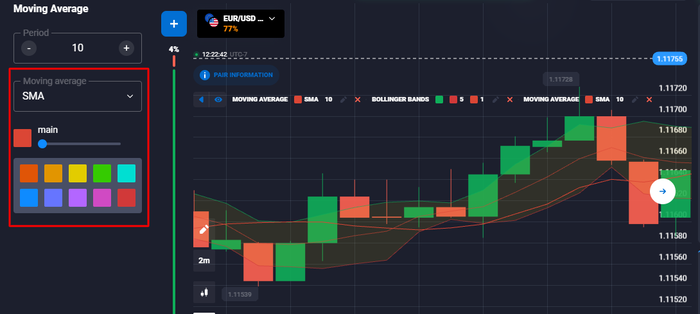
When you choose the SMA indicator on the Quotex platform and choose the desired period, the SMA calculates automatically.
Interpreting the SMA Signals
There is a relatively intuitive way of interpreting SMA signals. Quotex’s SMA line indicates when an asset’s price is in a bullish trend, which may mean it is an excellent time to buy.
Alternatively, when the price falls below the SMA line, it may indicate a bearish trend, which may be a perfect time to sell. It smoothes out price fluctuations and reveals the underlying trend more clearly by smoothing out the “noise.”
Combining SMA with Other Indicators
Combining the SMA with other indicators, such as the RSI and MACD, makes the SMA an even more powerful tool. On the Quotex platform, for example, a bearish SMA crossover combined with an RSI below 30 (indicating an oversold condition) provides a strong buying signal.
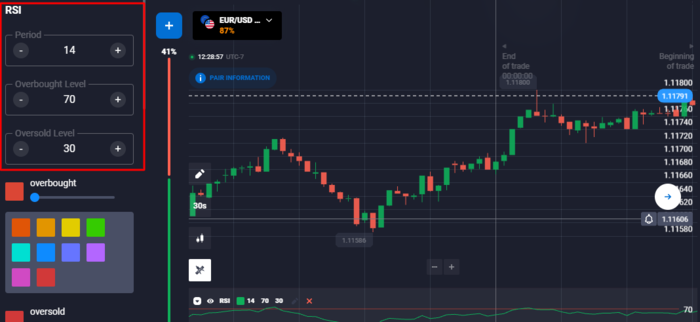
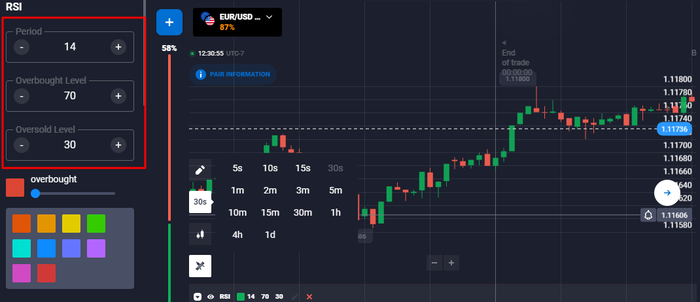
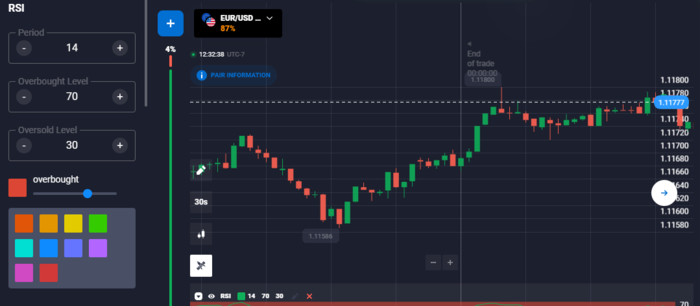
RELATIVE STRENGTH INDEX (RSI)
A momentum oscillator such as the Relative Strength Index (RSI) measures price changes and can be especially useful in identifying overbought and oversold conditions in the market, thereby aiding traders in predicting potential reversals.
How to Calculate the RSI
The RSI is calculated in six steps and requires some more complexity than other indicators.
Choose your period: The most common period for the RSI is 14 days, but you can use whatever period works for your trading strategy.
Calculate the daily price changes: Find out how much the price has changed each day for the chosen period. The price change is the amount by which the closing prices of two consecutive days differ.
Separate gains and losses: Compare increases (positive price changes) with losses (negative price changes) for each day of the period you selected.
Calculate the average gain and loss: The next step is determining the average increase and the average loss over the chosen period.
Compute the relative strength (RS): Take the average gain and divide it by the average loss. By doing this, you can determine your relative strength (RS).
Calculate the RSI: The RSI is obtained by plugging the RS into the RSI formula:
RSI = 100 – [100 / (1 + RS)]
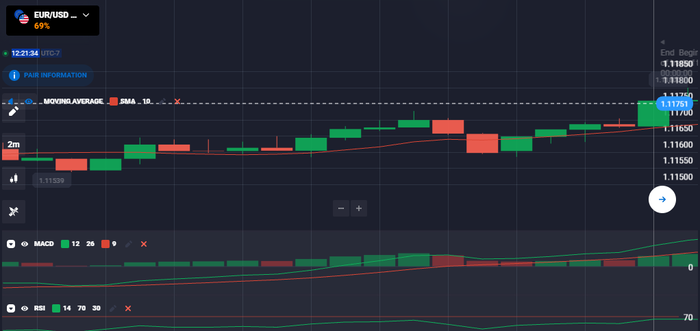
Thankfully, with Quotex, the RSI is automatically calculated by selecting the indicator and choosing your time frame.
Interpreting the RSI Signals
With the RSI, it’s possible to interpret market conditions accurately. If your Quotex chart shows an RSI value of 70 or above, there may be a trend reversal or a corrective price pullback. An RSI value of 30 or below, on the other hand, indicates an undervalued or oversold market condition, which could signal a reversal of the upward trend.
Combining RSI with Other Indicators
RSI combined with SMAs and MACDs may provide stronger signals when buying or selling. In the case of gold, for example, if the RSI falls below 30 (indicating oversold conditions) while the MACD crosses bullishly, it could be an excellent time to buy.
MOVING AVERAGE CONVERGENCE DIVERGENCE (MACD)
The MACD indicator tracks a security’s price trend by comparing two moving averages. MACD is particularly effective at identifying potential buy and sell signals.
How to Calculate the MACD
The calculation of the Moving Average Convergence Divergence (MACD) involves five steps.
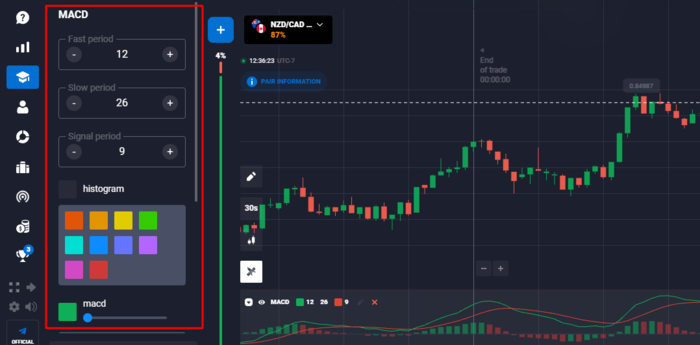
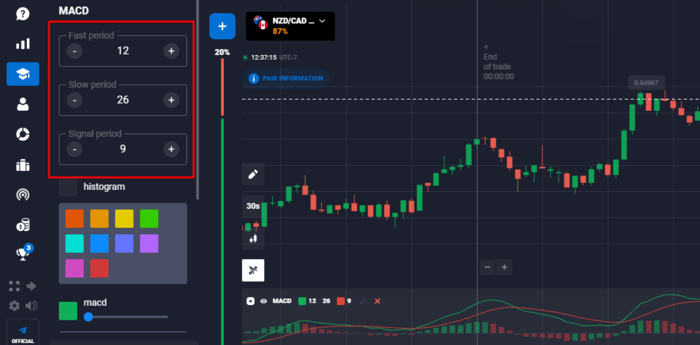
Choose your periods: MACD commonly uses 12, 26, and 9 periods. Depending on your trading strategy, you can adjust these parameters.
Calculate the EMAs: Determine your selected asset’s 12-day and 26-day Exponential Moving Averages (EMA). Recent prices carry more weight with an EMA, and a complex formula makes it possible to calculate it.
Compute the MACD line: Subtract the 26-day EMA from the 12-day EMA for the period. MACD is the resulting line.
Calculate the signal line: Find the MACD line’s 9-day exponential moving average, known as the signal line.
Plot the histogram: Draw the line that differs between the MACD and signal lines. This MACD histogram can determine signals for buying and selling.
By selecting the MACD indicator and inputting your desired periods, Quotex automatically calculates the MACD line, signal line, and histogram.
Interpreting the MACD Signals
It is possible to interpret MACD signals reasonably simply. If they cross above the signal line on your Quotex chart, they indicate that it may be an excellent time to buy. In contrast, if the MACD line crosses below the signal line, it suggests that a sale might be a good idea.
Combining MACD with Other Indicators
As with SMAs and RSIs, MACDs can become even more powerful when combined with other indicators. On the Quotex platform, a bullish MACD crossover combined with an uptrending SMA and an oversold RSI could be considered a strong buying signal.
CREATING A TRADING STRATEGY USING ALL THREE INDICATORS TOGETHER
Combined, these three indicators can give traders a comprehensive view of market conditions, enabling them to make well-informed decisions based on their unique insights into trends and momentum. A bullish MACD crossover, an SMA uptrend, and an oversold RSI on the Quotex platform signal it is time to buy. The opposite might be true if SMAs fall, RSIs are overbought, and MACDs cross bearishly.
BOTTOM LINE
Quotex traders can significantly improve their trading strategy by understanding and utilizing the SMA, RSI, and MACD indicators. Even though they can provide valuable insights individually, their combined use can provide more reliable insights, resulting in more informed trading decisions. A robust trading strategy incorporating these indicators can allow you to confidently make the most of the opportunities presented by the volatile markets.