Mastering Triangle Pattern Trading on Quotex: A Comprehensive Guide
Learn to trade triangle patterns on Quotex for profit. Identify bullish and bearish signals. Find support and resistance levels for successful trading.
-
 Saqib Iqbal
- 6 min read
Traders use many kinds of patterns in their technical analysis. In this article, we’ll cover various triangle patterns, which you can utilize on Quotex to turn a profit.
WHAT IS THE TRIANGLE PATTERN?
The name “triangle” is well-suited for this pattern because the trend lines above and below eventually converge on the right side, forming a corner. By connecting the starting point of the upper trend line to the beginning of the lower trend line, the remaining two corners are formed, creating a triangle.
The upper trend line is established by connecting the highest points, while the lower trend line is formed by connecting the lowest points.
How to Trade the Triangle Pattern on Quotex
Triangles can serve as patterns that indicate the continuation of a trend if confirmed. They can also indicate a strong pattern suggesting a trend reversal if it fails.
Price action often forms four types of triangles: symmetrical, ascending, descending, and wedge-shaped. Traders who analyze charts consider a breakout or failure of a triangular pattern, especially when accompanied by significant trading volume, as a significant signal of a bullish or bearish trend resumption or reversal, respectively.
TYPES OF TRIANGLE PATTERNS
There are four types of triangle patterns in trading, as illustrated below.
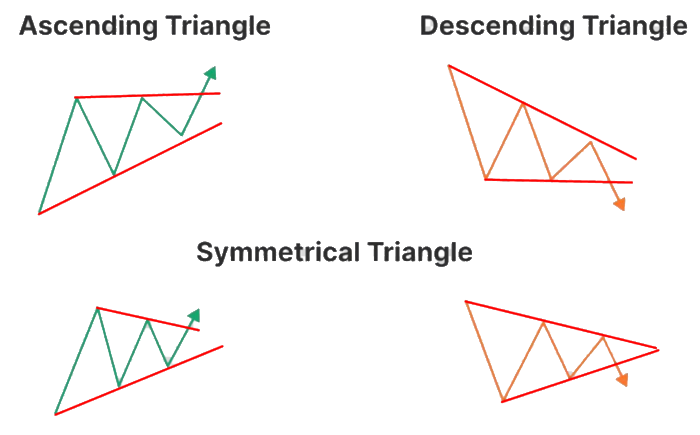
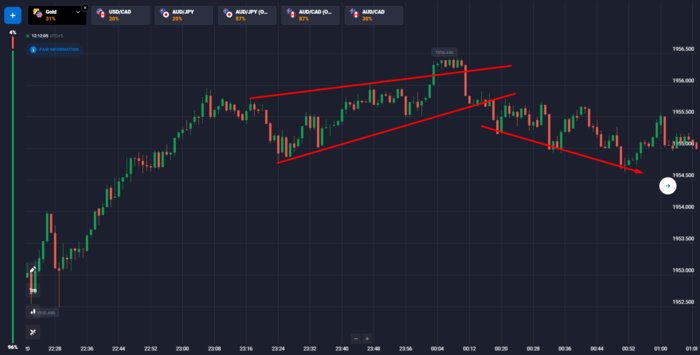
Symmetrical Triangle
A symmetrical triangle consists of two diagonal trend lines — one sloping downward and one upward.
When the price approaches the center of the triangle (known as the apex), it could inevitably break through the upper trend line, leading to an uptrend characterized by rising prices.
At the same time, it could break through the lower trend line, resulting in a downtrend marked by falling prices. This is the symmetrical triangle pattern trading.
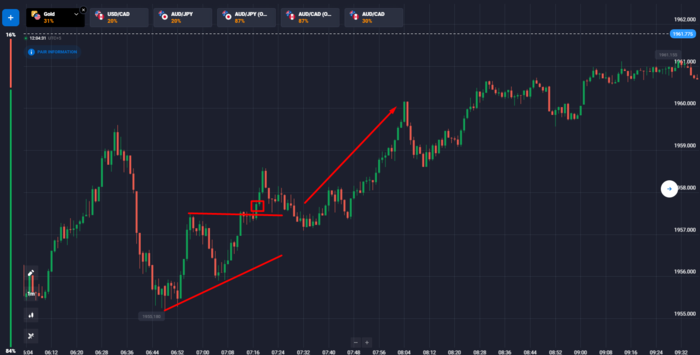
Ascending Triangle
An ascending triangle is a pattern where the price breaks through the upper horizontal trend line with increasing volume. This pattern indicates a bullish market trend. The upper trend line represents a resistance level formed by nearly identical highs. On the other hand, the lower trend line slopes upwards, showing higher lows as buyers gradually increase their bids.
Eventually, the buyers become eager and push the price above the resistance level, resulting in more buying activity and a continuation of the upward trend. The previously challenging upper trend line now acts as a support level for the price. This is the ascending triangle trading pattern.
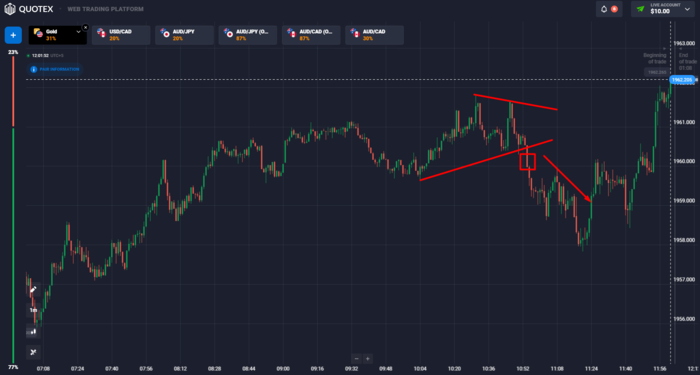
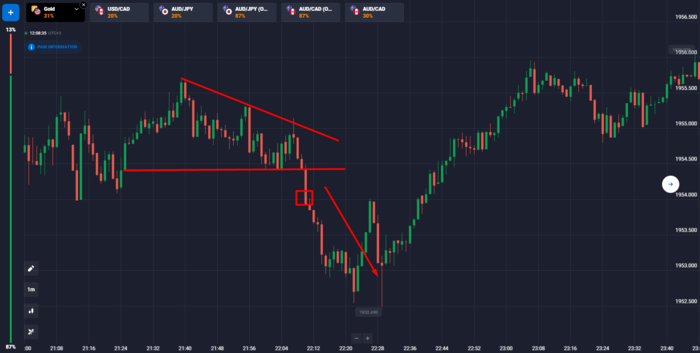
Descending Triangle
A descending triangle is essentially the opposite of an ascending triangle and is a pattern indicating a potential decline in price. In this pattern, the lower trend line remains flat and connects similar lows, while the upper trend line slopes downward towards the point where they meet.
The breakdown of this pattern happens when the price falls below the lower flat trend line, signaling the continuation of a downward trend. Interestingly, the lower trend line, which previously provided support, now acts as a resistance level. This is the descending triangle trading pattern.
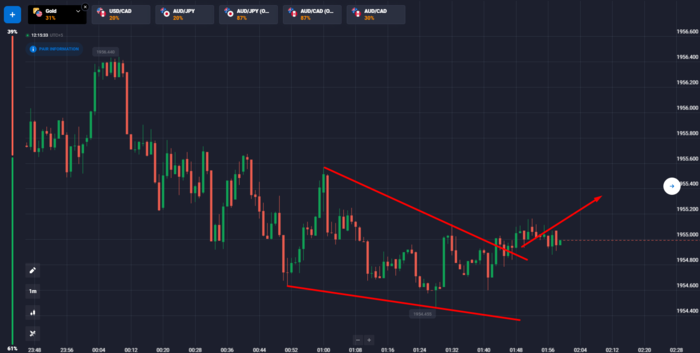
Wedge Pattern
A wedge pattern can indicate a potential change in price direction, whether it’s a bullish (positive) or bearish (negative) reversal. This pattern shares three main characteristics: first, trend lines converge towards each other; second, the volume tends to decrease as the price moves within the pattern; and third, there is a breakout from one of the trend lines.
The wedge pattern can take two forms: a rising wedge, which suggests a bearish reversal, or a falling wedge, which indicates a bullish reversal. You can see these below.
TIPS FOR TRADING TRIANGLE PATTERNS ON QUOTEX
Now that you understand triangle patterns, let’s go over some tips on how to trade them.
Set Reasonable Stop-Loss and Take-Profit Points
When trading the triangle pattern, try to place your stop loss beyond the breakout point just outside the triangle pattern. This safeguards your position if the breakout fails and the price reverses. This can save you from huge losses in case of false breakouts.
You should also set the take profit at a reasonable distance depending on your targets. Resistance levels usually make great targets.
Observe the Volume of Your Trade
When using the triangle pattern trading strategy, breakouts are important. Your entry point is at points where breakouts occur. Market volume is a key aspect of a breakout. Successful breakouts usually result in increased market volume.
Utilize Price Breakouts as Entry Signals
The price, as it progresses in the triangle pattern, will eventually break out from the trend lines, either above or below. Keep an eye out for this breakout, as it serves as a crucial signal for entry.
The breakout can happen in any direction in symmetrical triangles, while ascending and descending triangles tend to follow the trend lines’ slopes.
Identify False Breakouts and Avoid Entering Unprofitable Trades
You can avoid entering many unprofitable trades by watching out for false breakouts. False breakouts are mostly in low market volatility. Avoid entering trades when you see low market volatility during a breakout.
HORIZONTAL RESISTANCE AND SUPPORT LEVELS IN TRIANGLE PATTERNS
Horizontal resistance and support levels are key when trading triangle patterns, as they can act as targets for your trades. Here’s what you need to know about them.
Identifying a Horizontal Resistance Level
You can locate horizontal resistance levels by first locating previous peaks or where the price has reversed. You then connect these peaks with horizontal lines. These become your resistance levels. You should look for more areas where the price has reversed along this region. This strengthens your resistance level.
Identifying a Horizontal Support Level
Locating horizontal supports is easy. First, look for troughs or areas where price has gained support in the past. Connect these points with a horizontal line. This will be your horizontal support level.
BOTTOM LINE
Using a triangle pattern in trading is simple. All you need to know is the four types of triangle patterns and how to place your stop losses and take profits. Trading triangle patterns on Quotex can increase your chances of successful trading and turning a profit.