How to Use the Reversal Trading Strategy for Greater Profits in Quotex
Learn how to use the reversal trading strategy in Quotex. Identify trend shifts with indicators, analyze price action, and avoid false signals for profitable trades. Get tips for entering buy positions in downward trends effectively.
-
 Saqib Iqbal
- 7 min read
Are you looking to learn how to use the reversal strategy in Quotex? If so, you’re in the right place. Below you’ll find a comprehensive guide on using the reversal trading strategy in Quotex.
WHAT IS THE REVERSAL TRADING STRATEGY?
A reversal refers to a shift in the price movement of an asset, either in an upward or downward direction. If there has been a consistent increase in price (known as an uptrend), a reversal would indicate a subsequent decrease in price (to the downside).
Conversely, if there has been a consistent decrease in price (known as a downtrend), a reversal would indicate a subsequent increase in price (to the upside). You determine reversals by considering the overall price direction over several periods/bars on a chart.
To identify trends and reversals, various indicators such as moving averages, oscillators, or channels can be helpful. These indicators assist in identifying the prevailing trend and spotting potential reversals.
Benefits of Using the Reversal Trading Strategy

Here are some of the benefits you can experience while using this strategy.
The reversal trading strategy can help you capture most of the price movement and maximize profit potential by employing early entry into trends. Reversal strategies aim to identify turning points in price movements, allowing you the opportunity to enter a trade early in a new trend.
Trend reversal trading strategy offers favorable risk-reward ratios because you enter trades near potential reversal points and can set your stop-loss levels close to your entry points. By doing so, you can minimize potential losses.
By going against the norm, reversal strategy trading takes a contrarian standpoint. This strategy can be beneficial by allowing you to profit from the current trend’s exhaustion and take advantage of market reversals.
WORKING WITH PRICE ACTION
Price action refers to the dynamic changes in the price of a financial instrument represented on a chart over a specific period. It is the foundation for all technical analyses on various asset charts, including stocks, commodities, and so on.
Numerous short-term traders heavily depend on price action and the patterns and trends identified from it to make their trading choices. As a methodology, technical analysis stems from price action since it involves analyzing historical prices to make calculations that subsequently guide trading decisions.
Analyzing Historical Price Action
You can observe and analyze price action through charts representing price movements. You can utilize various chart types to enhance your ability to identify and interpret trends, breakouts, and reversals.
Candlestick charts are popular among traders because they provide a more precise visualization of price movements by showing the opening, high, low, and closing prices about upward or downward sessions.
Besides visual chart patterns, you can analyze price action data using technical indicators. This approach aims to discover patterns within seemingly random price fluctuations.
For instance, identifying an ascending triangle pattern using trendlines on a price action chart may suggest a potential breakout because the price action indicates repeated attempts by bulls to break out, gaining momentum with each attempt.
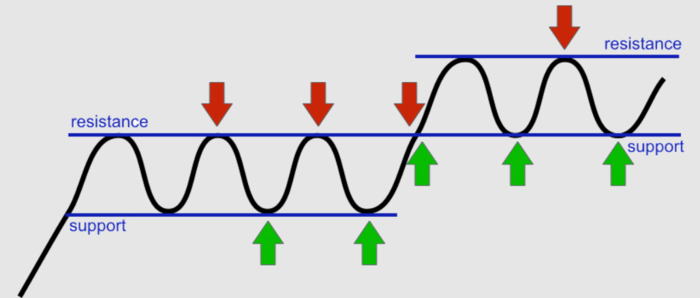
Identifying Support and Resistance Levels
Identifying support and resistance levels is an everyday endeavor for an online trader. You can identify support and resistance levels across various charting timeframes, including daily, weekly, and monthly.
You can also recognize support and resistance on shorter timeframes like one-minute and five-minute charts. However, the significance of support and resistance tends to increase with longer periods.
To spot support or resistance, you must examine historical price movements to find notable pauses in price declines or advances. Subsequently, you look ahead to determine whether the price stalls or reverses as it approaches those levels.
Experienced traders often pay attention to past support or resistance levels and place trades in anticipation of a similar reaction in the future.
Evaluating Key Candlestick Patterns
Candlestick patterns are a crucial aspect of trading. Here are some factors you should consider while evaluating key candlestick patterns.
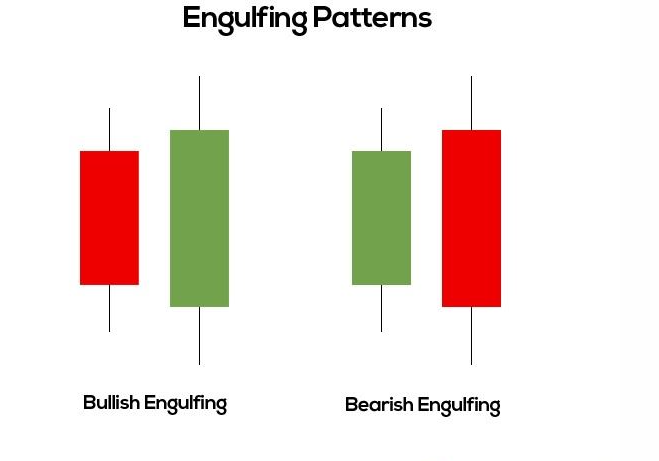
Having the ability to recognize specific candle patterns is crucial to this step. Educate yourself on common patterns like the doji, hammer, engulfing, harami, morning star, and evening star. Each pattern has a unique composition and effect on the price direction.
Considering the location of the candlestick pattern related to the overall price trend is also crucial. For instance, a bullish pattern that reverses at the end of a downtrend has more significance than if it occurred in the middle of an uptrend.
TECHNICAL INDICATORS FOR IDENTIFYING REVERSALS
There are numerous technical indicators on Quotex for identifying trend reversal. Here is a brief explanation of some of those indicators.
Powerful Indicators for Spotting Inverse Patterns
You can easily spot reversals using the following indicators.
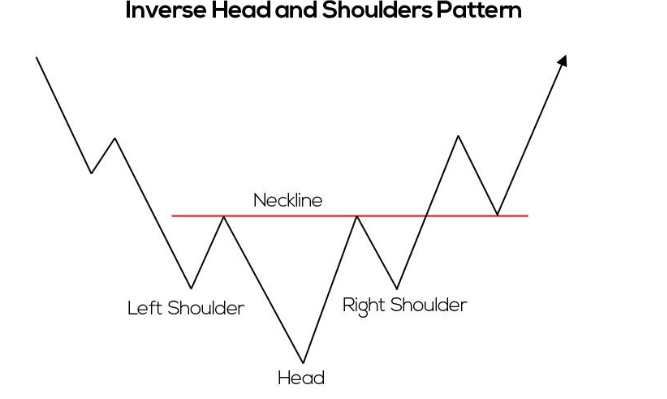
Inverse head and shoulders pattern: This pattern is an upbeat counterattack with three lows. The central low (head) is lower than the two adjacent lows (shoulders). It implies a potential switch in the direction of the trend from bearish to bullish.
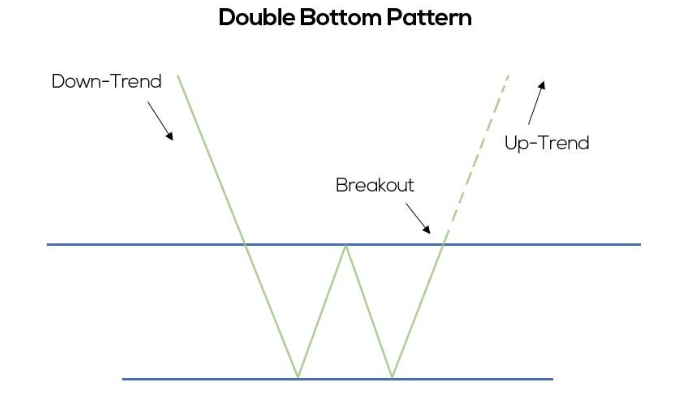
Double bottom: The double bottom pattern is a pattern that promotes growth following a decline. It comprises two approximately equal lows, separated by a high. The pattern suggests a potential return to the upside.
Bullish divergence: This happens when the price and an oscillator (e.g., the RSI, MACD) diverge. Bullish divergence is when the price and indicator have lower lows but the stock has higher lows. It implies the potential for a higher price.
Utilizing Momentum Oscillators to Detect Divergences
You can utilize momentum oscillators to detect divergences. Here’s how.
First, you should choose the right momentum oscillator. The oscillators available on Quotex are MACD, RSI, and stochastic oscillators.
You should then determine the current trend of the asset you are trading. You can use trendlines and moving averages to achieve this.
Identify significant peaks and troughs on the trending price movement and the momentum oscillator. These parts will assist us in locating divergences.
A bullish divergence occurs when the price makes lower lows while the oscillator makes higher lows. Bearish divergences, on the other hand, happen when the price makes higher highs while the oscillator makes lower highs.
Using Moving Averages to Generate Signals
Using moving averages can help identify both trends and potential reversals. When the price is above an upward-sloping moving average, it indicates an uptrend. On the other hand, if the price falls below the moving average, it may indicate the possibility of a price reversal.
Avoiding False Signals from Technical Indicators
Indicators may give you false signals. To minimize this, try implementing the following.
First, use multiple indicators. By doing so, you can confirm signals from these indicators to avoid false signals.
You should also stick with reliable indicators. Use indicators that have proven effective before.
TRADING TRANSACTION STRATEGIES FOR IMPLEMENTING THE REVERSAL TRADING STRATEGY
Before implementing the reversal trading strategy, it’s important to know about transaction strategies.
Setting an Entry Price and Profit Target
After identifying a potential reversal, wait for confirmation before executing the trade. Consider using a limit to ensure you enter exactly where you want to. Set a profit target based on your risk-reward ratio.
Executing a Sell Position at the Right Moment
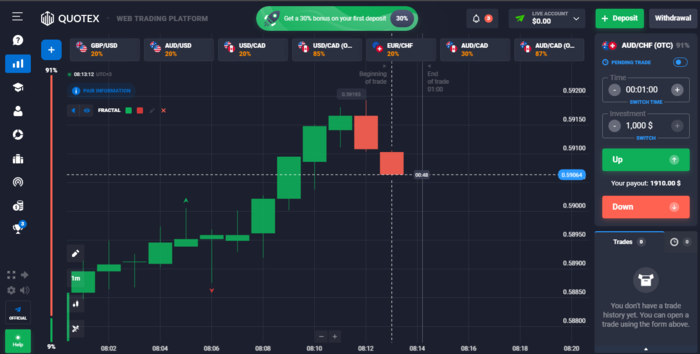
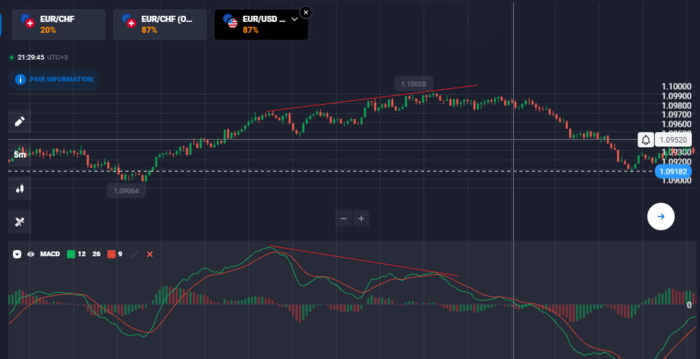
To execute a sell position right now, wait for a reversal confirmation before going short. You should also have specific criteria to meet before going short. It could be a break below a trendline, as shown below.
When to Take a Buy Position in Downward Direction
Taking a buy position in a drawdown requires a high level of market analysis. Let’s look at how to do this.
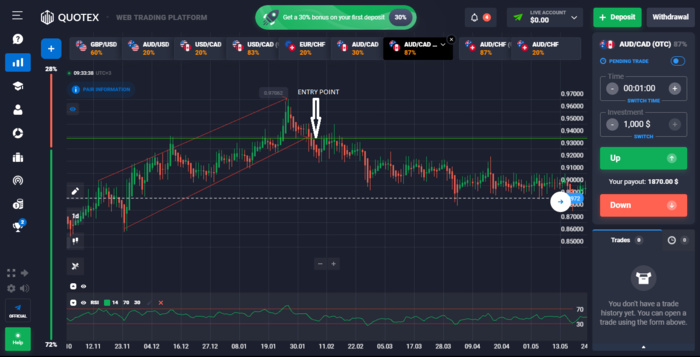
You need confirmation that the price will reverse in the upward direction. You should also pay attention to the trading volume during the reversal. An increase in volume is a good sign.
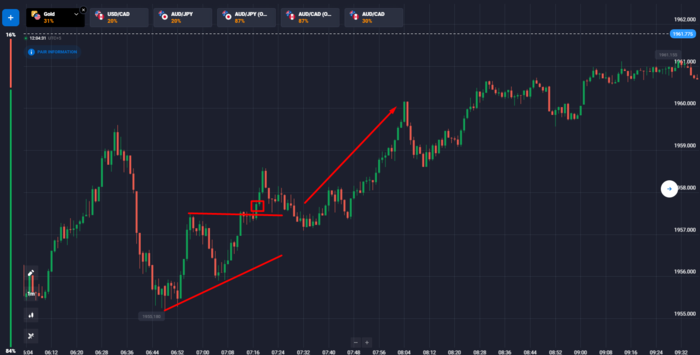
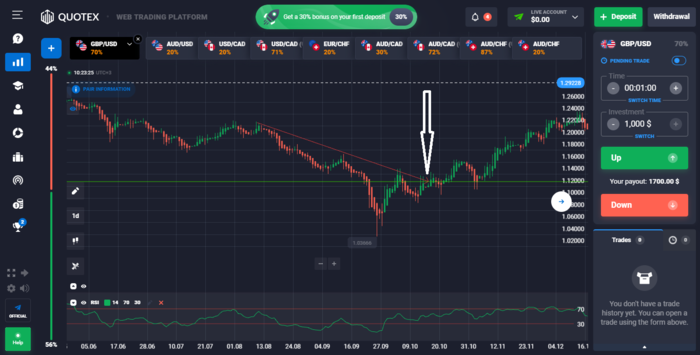
Analyze multiple time frames because reversals are more reliable when confirmed in multiple time frames. Lastly, evaluate the overall market conditions and sentiment. A buy position in a downward trend may be riskier in a bearish market or during heightened volatility. The image below shows a bullish reversal where the break above the bearish trendline confirms the entry.
BOTTOM LINE
The reversal strategy is a simple one to understand and implement on Quotex. This strategy relies greatly on technical analysis. Therefore, you should be good at studying charts to make a profit using this strategy.