Mastering the Quotex Rebound Line Strategy: Maximizing Profits from Price Bounces

Learn how to profit from price bounces using the Quotex rebound line strategy. Identify trends, resistance levels, and bearish signals for successful trading.
-

- 7 min read
Learn how to make money on Quotex using the rebound line strategy. Below you’ll find everything you need to know to profit from price bounces while online trading.
DEFINITION OF REBOUND LINE STRATEGY ON QUOTEX
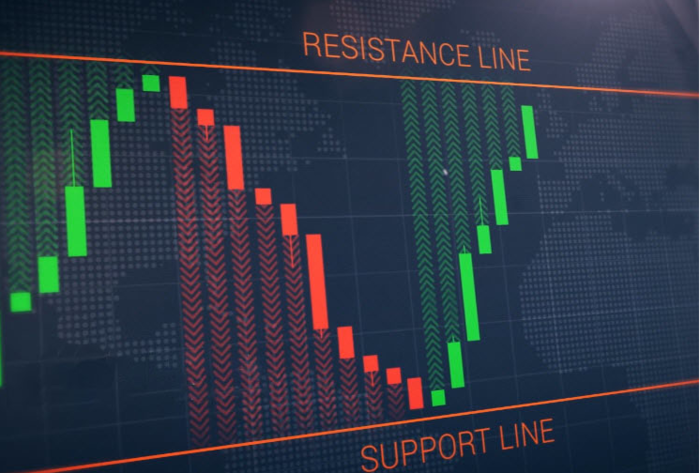
The rebound line strategy is used to identify potential market reversals or bounces from support or resistance levels. You have to look for signs of a rebound when the price reaches key support or resistance levels.
Benefits of the Rebound Line Strategy
- Position entry: The strategy helps you find an accurate entry into the market by considering the historical levels. The price reacts around those levels.
- Risk management: As an active trader, you must gauge your risk in each entry. Hence, this strategy’s key levels help you precisely allocate risk for every position.
- Higher winning probability: The rebound strategy increases your odds of success as the price action respects the historical levels.
BACKGROUND ON PRICE BOUNCES
Now let’s delve into the details of price bounces. When a stock, currency pair, or commodity reaches a point on the chart where it encounters resistance to further declines (known as support) and reverses, it’s referred to as a ‘bounce.’ This support level can be seen as a trend line, a moving average, or a combination of both.
Causes of Price Bounces
- Price bounces often occur at well-defined support and resistance levels. These levels are formed based on historical price action, where buyers (support) or sellers (resistance) have previously entered the market in large numbers. When the price reaches these levels again, market participants may react based on their previous experiences, leading to a potential price reversal.
- Price bounces can result from shifts in supply and demand dynamics. When the price reaches a support level, demand may increase as buyers perceive the price as attractive. This increased buying pressure can lead to a rebound in the price. The opposite happens at resistance levels.
- Market psychology plays a crucial role in price bounces. Traders and investors may have psychological tendencies to buy near support levels and sell near resistance levels. This behavior is driven by the fear of missing out (FOMO) on potential price increases near support or the fear of losing money (FOLM) near resistance. These psychological factors can contribute to price reversals.
Types of Price Bounces
There are different types of price bounces, as explained below.
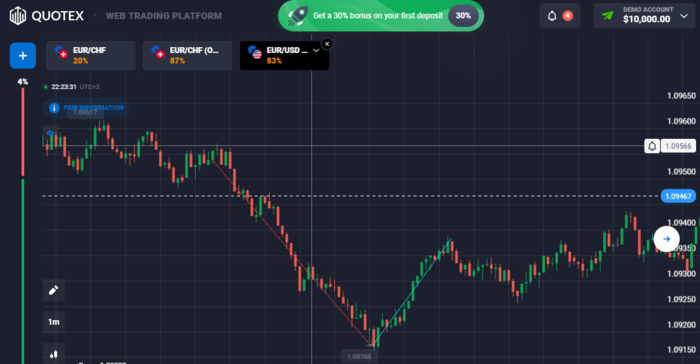
- V-shaped bounce: A V-shaped bounce occurs when the price reverses direction after reaching a support or resistance level. It forms a sharp V-shaped pattern on the price chart.
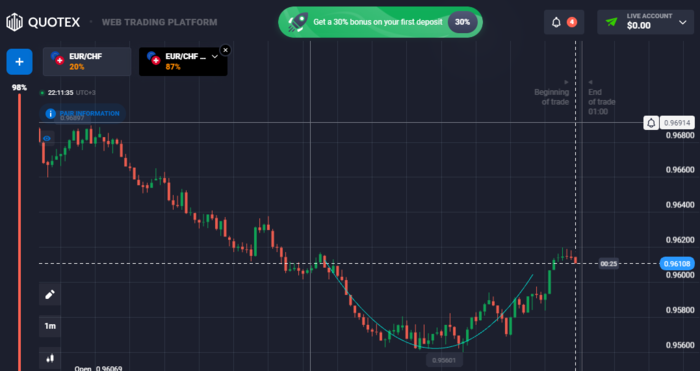
- U-shaped bounce: A U-shaped bounce, also known as a rounded bottom or saucer pattern, is characterized by a more gradual and rounded reversal in the price after reaching a support level.
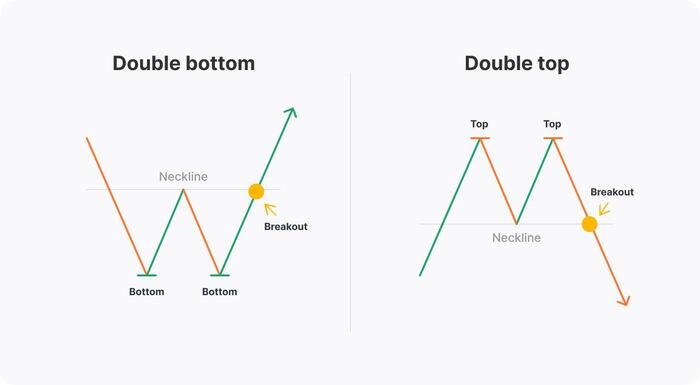
- Double bottom or double top: The double bottom pattern occurs when the price reaches a support level, bounces upward, pulls back, and then bounces again near the same support level. The opposite is also true for a double top.
Understanding Initial Bounces vs. Successful Bounces
Initial bounces refer to the first rebound or reversal in price that occurs after the price reaches a support or resistance level. These bounces represent the immediate reaction of market participants to the support or resistance level.
Successful bounces occur when the initial rebound in price develops into a sustained price reversal that aligns with the trader’s expectations. These bounces confirm the effectiveness of the support or resistance level in stopping the price movement and potentially changing the direction of the trend.
ANALYZING THE MARKET FOR REBOUND LINE OPPORTUNITIES
Now let’s look at how to analyze the market for rebound line opportunities.
Factors to Look For in Potential Opportunities
- Clear support or resistance levels: Identify well-defined support or resistance levels on the price chart.
- A confluence of multiple indicators: Look for the confluence of multiple indicators or technical analysis tools that reinforce the potential rebound.
- Price confirmation: Wait for a price confirmation before entering a trade. This involves observing how the price reacts near the support or resistance level.
Using Technical Analysis Patterns to Identify Entry and Exit Points
When trading, you need more than one reason to enter a trade. As outlined below, technical analysis patterns can be valuable tools for identifying entry and exit points when trading rebound line opportunities. Here are some commonly used patterns and how they can be applied.
Bullish Reversal Patterns
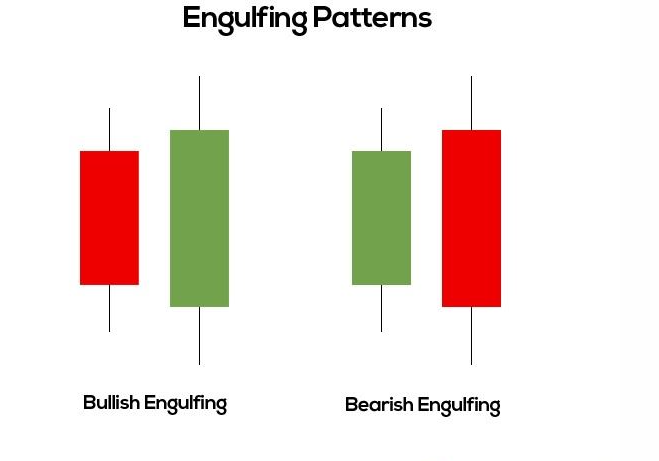
- Bullish engulfing: This candlestick pattern occurs when a larger bullish candle completely engulfs the previous bearish candle. It suggests a shift in market sentiment and is a potential entry point for long positions.
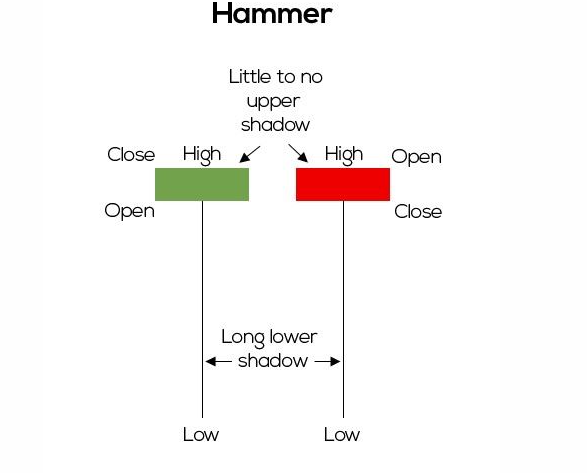
- Hammer: The hammer pattern has a small body and a long lower shadow, indicating that sellers initially pushed the price lower but buyers stepped in and pushed it back up. It can signal a potential reversal in the trend, and traders may consider entering long positions when they observe a hammer near a support level.
Bearish Reversal Patterns
- Bearish engulfing: This candlestick pattern occurs when a larger bearish candle completely engulfs the previous bullish candle. It suggests a shift in market sentiment and is a potential entry point for short positions.
- Shooting star: The shooting star pattern has a small body and a long upper shadow, indicating that buyers initially pushed the price higher but sellers took control and pushed it back down.
Considering Broader Markets and Risk Tolerance Levels
When implementing a rebound line strategy, consider broader market conditions and risk tolerance levels. Here are how these factors come into play.
- Market trend: Assess the overall trend of the broader market. If the market is in an uptrend, it may increase the likelihood of successful bounces off support levels, providing potential long opportunities.
- Market volatility: Consider the level of volatility in the market. Higher volatility can lead to larger price swings and potentially more significant rebounds. However, it also carries increased risk.
- Risk parameters: Determine risk tolerance levels and establish clear risk management guidelines.
Utilizing Meta Platforms, Zacks Investment Research, and Standard Deviations
Meta Platforms offer communication channels and communities where traders and investors can share ideas, strategies, and market analysis.
Using the research and insights from Zacks Investment Research can also assist you in identifying potential rebound line opportunities within specific stocks or sectors.
You can also incorporate standard deviations in your rebound line strategy by analyzing price movements relative to historical volatility.
ESTABLISHING A TRADING STRATEGY FOR PRICE BOUNCES
You can establish a trading strategy for price bounces by following the steps below.
Setting a Period for the Trade
Setting a period for the trade is an important consideration. The period you choose will depend on your trading style, goals, and the specific characteristics of your target price bounce.
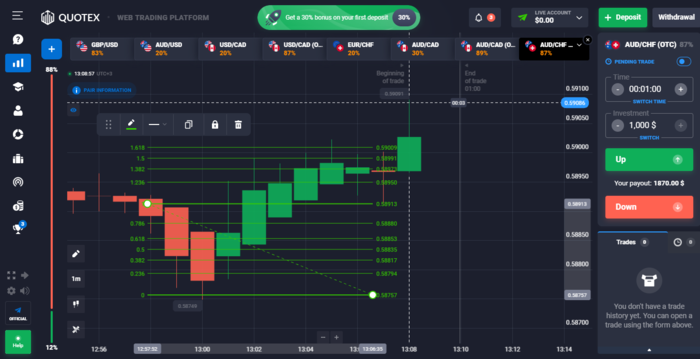
Establishing Fibonacci Retracement Levels
You can incorporate Fibonacci by identifying significant swing high and low points on the price chart. These points show plotted Fibonacci levels (23.6%, 38.2%, 50%, 61.8%, and 78.6%).
Observe price reactions near these levels to determine potential support or resistance. Bounces off Fibonacci levels suggest support or resistance, while decisive breaks indicate trend continuation or reversal.
Recognizing Bearish Trends or Sell Signals
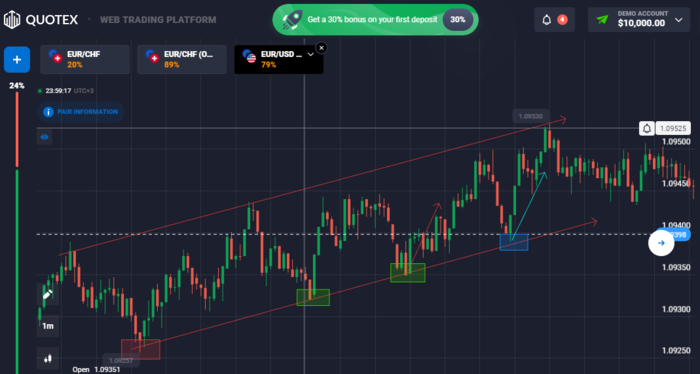
It is important to identify the prevailing bearish trend by looking for lower highs and lower lows on the charts. Use technical indicators like moving averages and trend lines to confirm the trend.
Additionally, you can locate resistance levels and watch for price breakdowns below them, supported by increased selling volume.
Lastly, identify bearish reversal patterns and utilize momentum indicators to spot overbought conditions and potential selling opportunities.
BOTTOM LINE
As shown above, the Quotex rebound line strategy is simple to understand and implement. Identify support and resistance levels on the chart. Then every time the price retests this level, wait for an entry signal and buy. Following these steps will increase your chances of profiting in the financial markets using this strategy.