How to Read and Use the Chaikin Volatility Oscillator on Qutotex

Discover how the Chaikin Volatility Oscillator improves trading on Quotex. Understand its uses, benefits, and strategies for USD/JPY pairs.
-

- 15 min read
Many experienced traders use the Chaikin Volatility Oscillator when trading on Quotex. Below is a highly comprehensive documentation of how you use it to improve your trading on Quotex. The images in this article are from Tradingview since Quotex currently lacks this indicator. Therefore, you can analyze on Tradingview and use the analysis to trade on Quotex.
WHAT IS THE CHAIKIN VOLATILITY OSCILLATOR?
The Chaikin oscillator bears Marc Chaikin’s name, who invented it.
The oscillator measures the moving average convergence-divergence (MACD) accumulation-distribution line.
Subtract a 3-day exponential moving average (EMA) of the accumulation-distribution line from a 10-day EMA of the accumulation-distribution line to obtain the Chaikin oscillator. Using oscillations around the accumulation-distribution line as a predictor, this measures momentum.
Benefits of Using the Chaikin Volatility Oscillator
Here are some benefits you can experience by using the Chaikin Volatility Oscillator.
Volatility tracking: The Chaikin Volatility Oscillator provides a numerical representation of volatility. By studying the gap between high and low prices, it can help you assess the degree to which the market is volatile. High volatility is likely to indicate trading opportunities, while low volatility indicates a lack of price movement.
Trend tracking: The Chaikin Volatility Oscillator can help you identify the magnitude and heading of a trend. When the oscillator is moving up, it implies it’s increasing in volatility. A trending market can accompany this. Conversely, a decrease in the oscillator’s motion may indicate a decrease in volatility; this may signify a period of consolidation or a range-bound market.
Confirmation of breakout: Volatility is often higher during market outbreaks. You can use the Chaikin Volatility Oscillator to assess the probability of a breakout by observing a significant increase in the oscillator’s value.
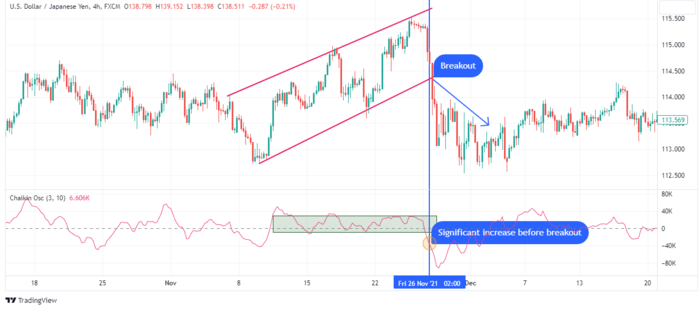
If the price begins to rise outside of the current range and the oscillator also increases, it increases the probability of a breakout.
Reversal warning: The Chaikin Volatility Oscillator can also identify potential trend reversals. When the volatility reaches a high degree, it may indicate an overbought or oversold condition, as illustrated below.
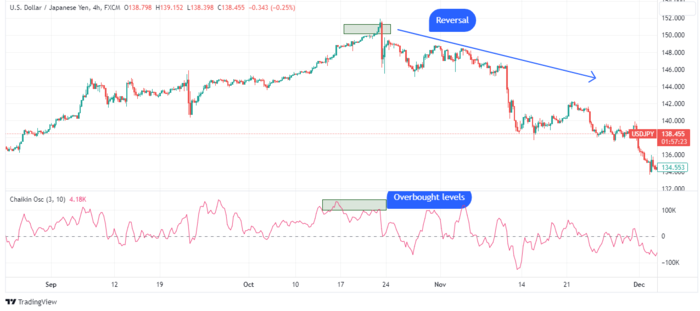
For instance, if the oscillator has a high amplitude while the price is near the resistance, this could indicate a bearish shift. Similarly, low volatility and the price near the support could indicate a bullish shift.
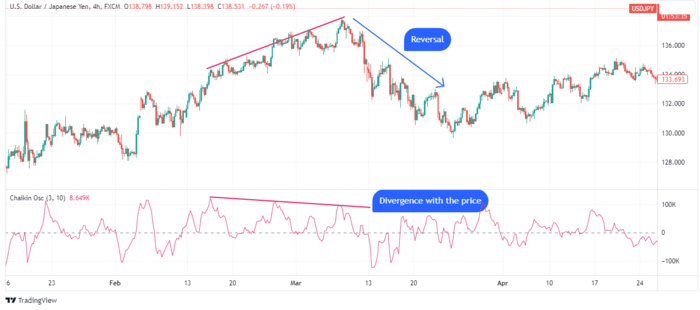
Divergence analysis: You can utilize divergence analysis to determine if a potential trend will reverse. You can combine the Chaikin Volatility Oscillator with price action to identify divergences. If the price increases while the oscillator decreases, it could signify diminishing momentum and a potential reversal.
Risk management: Volatility relates to risk. Higher volatility is associated with larger price changes and a greater potential for either profits or losses. Observing the Chaikin Volatility Oscillator allows you to appropriately adjust your risk management approaches.
For instance, during periods of high variance, you might reduce the size of your positions or limit the maximum duration of your orders to prevent the risk of over-exposure.
READING THE CHAIKIN VOLATILITY OSCILLATOR ON QUOTEX
When trading on Quotex, you can use the Chaikin Volatility Oscillator by following the steps below.
The Chaikin oscillator identifies momentum during accumulation and distribution fluctuations. It uses the MACD indicator for accumulation distribution instead of closing prices.
For instance, when you see the MACD trending higher and the Chaikin oscillator crosses above the accumulation-distribution line, it indicates a bullish divergence. This suggests a potential price increase.
The Chaikin oscillator has two primary signals. There is a bullish divergence with a center-line crossover above the accumulation-distribution line. This indicates a buying opportunity.
Additionally, a bearish divergence with a center-line crossover below the accumulation-distribution line indicates a selling opportunity.
Positive divergence suggests a likely price rise due to increased accumulation. On the other hand, negative divergence suggests a likely price fall due to increased distribution.
Understanding Price Action and Volume Oscillators
Before using volume oscillators to interpret price action, you must understand what they tell you.
Technical analysts, rather than fundamental analysts, use the Chaikin oscillator. They focus on a company’s business performance to predict its stock price direction.
Fundamental analysts believe that being well-informed is crucial for market forecasting. On the other hand, technical analysts believe that all relevant information is already present in stock prices and that patterns in price fluctuations can better predict market movements. Technical analysts utilize the Chaikin oscillator to identify trends in momentum.
To understand how the oscillator is employed, imagine being at an auction with buyers (accumulators) on one side and sellers (distributors) on the other. When sellers outnumber buyers, the price of the auctioned item decreases. Conversely, when buyers dominate, the price tends to increase.
You can view this balance between buyers and sellers as the driving force behind financial markets. You assess this balance using various indicators, including accumulation-distribution indicators like the Chaikin oscillator.
How to Calculate the Chaikin Volatility Oscillator on Quotex
Let’s look at how to calculate the Chaikin Volatility Oscillator when trading on Quotex.
- Figure out the typical cost of each period: The typical cost is the average of the high, low, and closing prices for a particular period. You can calculate it using the formula: Typical Price = (High + Low + Close) / 3.
- Find the daily price range for each period: The price range is the difference between the high and low prices for a particular period.
- Compute the 10-day EMA of the daily price range: Add the prices of the past ten periods and divide the total by 10 to obtain the average. This average is the 10-day EMA of the daily price range.
- Estimate the percentage alteration in the 10-day EMA: Figure out the percentage alteration of the 10-day EMA compared to the previous 10-day EMA. You calculate the percentage change using this formula: (Current EMA – Previous EMA) / Previous EMA) * 100.
- Calculate the 10-day simple moving average (SMA) of the percentage change: Add the percentages for the past ten periods and divide the total by 10 to obtain the average. This average is the 10-day mean of the percentage increase or decrease.
- Compute the Chaikin Volatility Oscillator: Subtract the 10-day mean of the percentage change from the 10-day mean of the daily price range. The outcome is the Chaikin Volatility Oscillator’s value for the particular period.
Follow these steps for each period in your preferred timeframe to calculate the Chaikin Volatility Oscillator values.
Identifying Market Trends with the Chaikin Volatility Indicator
You can also use the Chaikin Volatility Indicator to identify trends in the financial market. The market trend is the price direction of an asset over time.
In technical analysis, an uptrend, often known as the bull market, occurs when prices undergo a succession of higher and lower highs. Prices are said to be in a downtrend when they have consecutive lower highs and lower lows, often known as the bear market.
Here is how to identify market trends using the Chaikin volatility.
- First, calculate the Average True Range (ATR) of the price chart. The ATR is a component of the Chaikin volatility indicator. It is the average of true ranges during a given period, and it considers price volatility while also accounting for any gaps in price movement. You calculate the ATR using 14 periods, which can be of various timeframes such as intraday, daily, weekly, or monthly.
- Secondly, you should calculate the Chaikin volatility indicator. You can find the difference between the current day’s ATR and the previous day’s. From this calculation, you should see a percentage change in the ATR values. This indicates the volatility trend.
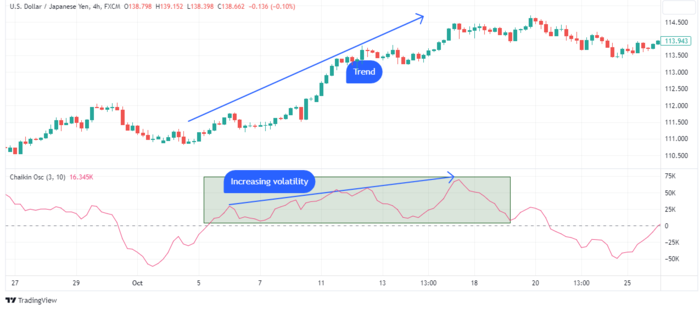
- You should then analyze the Chaikin volatility indicator values. If the values are positive, then this means that the market has increased in volatility. Increased volatility indicates a trending market. You can see that in the image below. This is because high volatility accompanies strong price movements in either direction. These are trends. If the values are negative, this means the market is less volatile. It suggests a lack of a clear trend.
- Lastly, there is no sure way of identifying trends in a market. The Chaikin volatility indicator is not 100% accurate. You’ll need to combine these findings with those of other indicators offered on Quotex. These include moving averages, trendlines, and other momentum indicators.
Recognizing Trend Reversal Signals with the Chaikin Volatility Indicator
Other than trend identification, you can also use the Chaikin volatility indicator to recognize trend reversals. A reversal is a shift in an asset’s price trend. Reversals can happen either upward or downward.
A downward trend reversal would occur after an upward trend. A trend reversal after a decline would be upward. Reversals are based on the general price direction rather than just one or two periods or bars on a chart.
Reversals occur frequently and swiftly in intraday trading but can also occur over days, weeks, and years. Reversals occur in various time frames that are important to different traders. A five-minute intraday reversal is meaningless to a long-term investor looking for a reversal on daily or weekly charts. However, a five-minute reversal is critical for a day trader.
An uptrend, which consists of higher swing highs and higher lows, reverses into a downtrend by displaying lower and lower lows. A downtrend, which consists of lower and lower highs, flips into an uptrend by displaying higher lows.
Here’s how to use this indicator to recognize trend reversals on Quotex.
First, identify a prevailing trend. This could be either an uptrend or a downtrend. You can achieve this by analyzing price movements and other trend-following indicators.
After successfully identifying the prevailing trend, monitor the Chaikin volatility indicator values. These values show you the volatility of the market. If there is an abrupt change in these values, this means there is increased market volatility. Increased market volatility usually leads to a trend reversal. This is a result of market participants adjusting their positions.
You can also identify a trend reversal by considering divergences between the Chaikin volatility indicator and the price. There are two types of divergences.
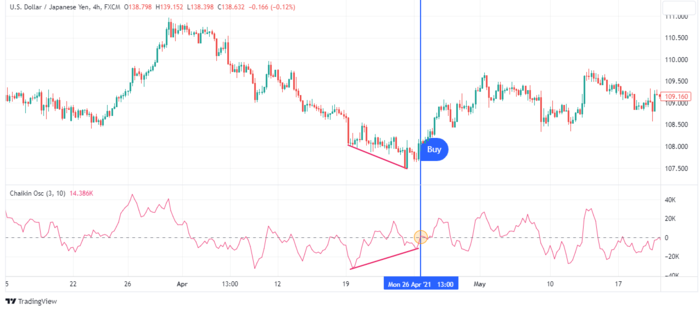
The first type is a bullish divergence. It occurs when the price makes lower lows but the Chaikin volatility indicator makes higher lows. This can indicate a reversal to the upside.
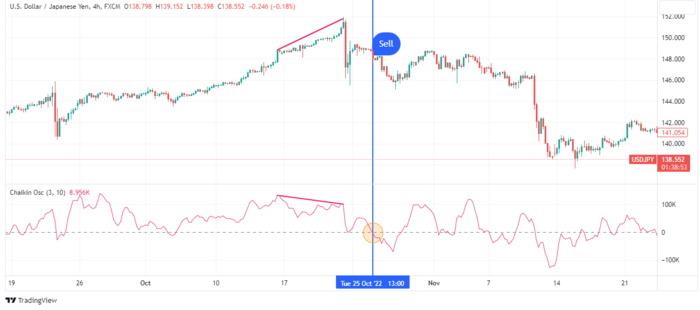
The second type of divergence is the bearish one. This occurs when the price makes higher highs while the Chaikin volatility indicator makes lower highs. This can indicate a trend reversal to the downside. You can see this in the illustration below.
Furthermore, extreme Chaikin volume indicator values can also indicate a trend reversal. If, after an extended uptrend, the Chaikin volume indicator reaches very high levels, it might signal a trend reversal on the downside.
The converse is true. If the Chaikin volume indicator value is low after a prolonged downtrend, this is a sign of a trend reversal to the upside.
No single indicator is sure to show you a trend reversal. To increase your chances of identifying an accurate trend reversal, combine this indicator with other indicators offered on Quotex. They include momentum oscillators. You can also incorporate candlestick patterns and resistance and support levels.
You should also consider the overall market conditions. Assess fundamental factors, news events, and overall market sentiment to understand the potential trend reversal comprehensively.
Understanding Oversold and Overbought Signals with the Chaikin Volatility Indicator
You can also use the Chaikin volatility indicator to determine oversold and overbought conditions in the market. Let’s look at how to do this.
First, determine the overbought and oversold levels. This depends on your trading strategy and the specific market you are trading. Set levels that, according to historical price patterns and market behavior, show that the market is overbought or oversold
Second, monitor the Chaikin volatility indicator values. If the values reach the predetermined high level, the market is overbought. The market is extremely bearish, and a potential selling position will occur.

The converse is true. If the indicator levels fall below the predetermined low level, this indicates an oversold condition—a potential buying opportunity.
Interpreting False Breakouts with the Chaikin Volatility Indicator
Moreover, you can use the Chaikin volatility indicator to identify false breakouts in the market. A false breakout happens when the price surpasses a known support or resistance level but lacks sufficient momentum to sustain the movement.
Traders who enter positions based on breakouts in the initial direction might choose to close those trades if the breakout fails.
False breakouts can also prompt you to enter trades in the opposite direction of the attempted breakout. As the breakout attempt proves unsuccessful, the price may move in the opposite direction.
A failed breakout indicates insufficient buying pressure to sustain the price above a resistance level or below a support level.
Following a failed breakout, short-term, you may close your position if you anticipate a breakout. The trade did not meet your expectations due to the inability to achieve the desired price movement.
The Chaikin volatility indicator can help identify these false breakouts in the market. Here’s how you can interpret false breakouts using the Chaikin volatility indicator:
You should first determine the key support and resistance levels.
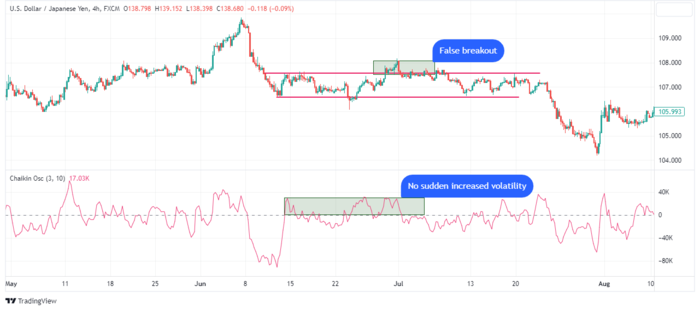
You should then monitor the Chaikin volume indicator values during the breakout attempt. If, during the breakout, the values indicate low volatility, then it is a false breakout. False breakouts generally exhibit low volatility.
TRADING STRATEGIES FOR USD/JPY PAIRS USING THE CHAIKIN VOLATILITY OSCILLATOR ON QUOTEX
Now let’s look at trading strategies on the USD/JPY pair using the Chaikin volatility indicator.
Setting up a Trading Platform for USD/JPY Pairs on Quotex
Access your Quotex account. Select the USD/JPY pair which you will trade during this session. It is in the list of assets accessed at the top corner of the trade execution window, denoted by a ‘+’ symbol.
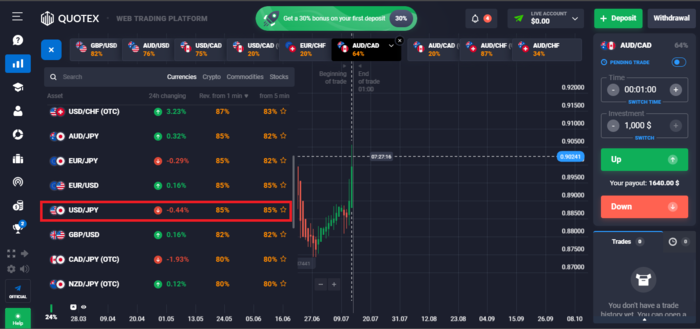
Then determine the chart period. Click on the chart analysis icon, then on the volatility indicator group. Chaikin Volatility will appear.
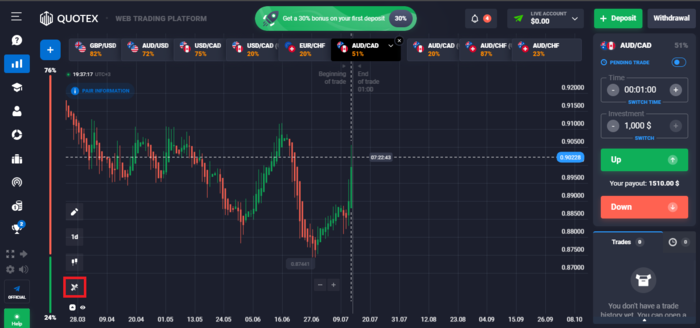
Of course, you can also begin typing the name of the required indicator in the search field and find it that way.
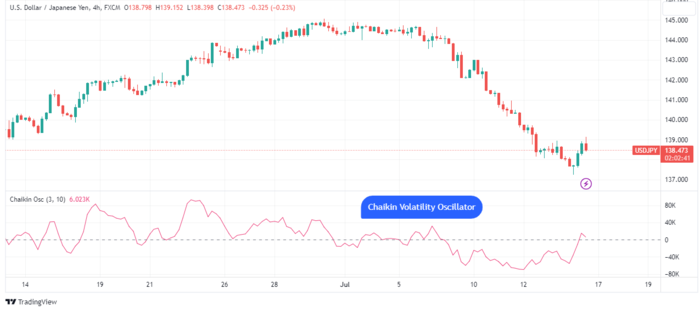
The indicator will appear in a separate window below your price chart. It takes the shape of a line that oscillates around the zero line.
Implementing Day Trading Strategies for USD/JPY Pairs on Quotex
You can use the Chaikin volatility indicator to trade USD/JPY. Here is how.
First, you should establish resistance and support levels. You can use the moving averages or simply study the price action.
As the price approaches these levels, monitor the Chaikin volatility indicator values. If the values indicate high volatility, this means the break is a legit one. You can take a position immediately or wait for the price to retest the resistance or support.
Like any strategy, risk management is paramount. Have your stop losses and take profits at appropriate levels.
If the readings of the Chaikin Volatility Oscillator show low volatility at the resistance level, this can be a sign of a fake breakout. As illustrated, fake breakouts showcase low volatility at the resistance points. For this strategy, you should avoid these. Fake breakouts mean the market will not move significantly; fetching profits will take work.
Using 60-Second Binary Options Trading Strategies for USD/JPY Pairs on Quotex
You can use a 60-second binary options trading strategy on the USD/JPY currency pair. This is called scalping. Scalping is based on the belief that markets will complete an initial movement stage, but their subsequent direction is uncertain. While some markets stop advancing, others continue to rise.
Scalpers aim to take numerous small profits, contrasting with the “let your profits run” mindset that seeks to maximize gains by increasing the size of winning trades. This approach focuses on generating more winning trades while accepting smaller profits.
Traders with longer time frames may achieve positive results by winning only a portion of their trades as long as the wins outweigh the losses significantly. In contrast, successful scalpers aim for a higher ratio of winning trades to losing ones, with profits roughly equal to or slightly larger than losses.
The key principles of scalping are as follows:
- Limited exposure reduces risk: Brief exposure to the market decreases the likelihood of encountering adverse events.
- Smaller price moves are more attainable: Larger price changes require a greater supply and demand imbalance. For instance, a stock is likelier to make a $0.01 move than a $1 move.
- Smaller price moves occur more frequently: Even in relatively calm markets, scalpers can capitalize on numerous small price movements.
CONCLUSION: BENEFITS OF USING THE VOLATILITY CHAIKIN OSCILLATOR ON QUOTEX
The Chaikin Volatility Oscillator has the following advantages:
- Volatility tracking: It calculates market volatility, identifying trading opportunities and price movement.
- Trend tracking: The oscillator can help determine the amount and direction of a trend, showing increased or decreased volatility.
- Breakout confirmation: A big increase in the oscillator’s value during a price climb beyond the current range increases the likelihood of a breakout and potential rewards.
- Trend reversal alert: It can detect probable trend reversals by detecting overbought or oversold conditions based on high volatility near resistance or low volatility near support.
- Divergence analysis: Combining the oscillator with price action can find divergences in which the price rises while the oscillator falls, indicating a trend.
BOTTOM LINE
The Chaikin volatility indicator is a volume indicator. It has numerous benefits you can easily access on the Quotex trading platform. Using this indicator, you can employ different strategies to trade numerous assets on Quotex, including the USD/JPY currency pair, as demonstrated in this article.