Quotex Chart Types: How to Choose the Best One for Your Trading Style
Discover the various Quotex chart types for online trading, including candlestick, linear, bar, and Heiken Ashi charts. Learn how to choose the best one for your trading style.
-
 Saqib Iqbal
- 15 min read
Quotex offers you various chart types for your online trading requirements. In this article, you’ll learn how to choose the best one for your trading style.
WHAT ARE CHARTS ON QUOTEX?
Charts are graphical representations of the historical price movements of a particular asset, such as stocks, commodities, cryptocurrencies, or currency pairs. They visually represent the price action over a specific period. This allows you to analyze and interpret market trends, patterns, and potential future price movements.
Charts on Quotex typically display the price on the y-axis (vertical axis) and the time on the x-axis (horizontal axis).
You can customize these charts to display different time frames, such as short-term intraday charts or long-term charts spanning several years. Furthermore, you can use various technical analysis tools and indicators, such as moving averages and trendlines, in conjunction with price charts, to make informed trading decisions.
Different Types of Charts on Quotex
Quotex offers four chart types for online trading, as detailed below.
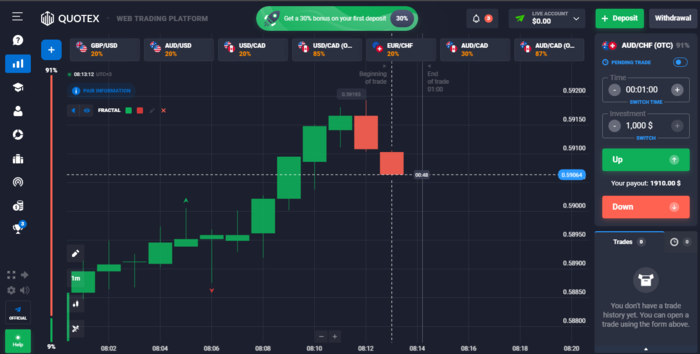
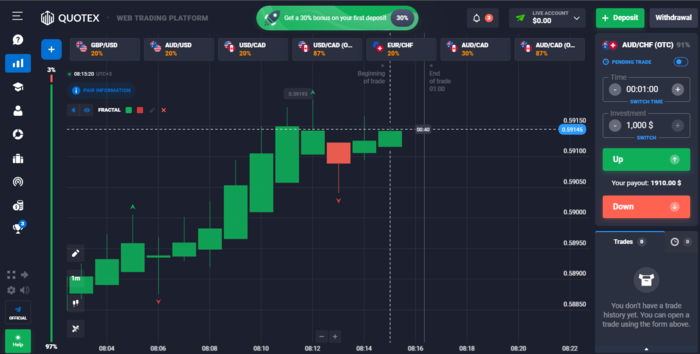
Candlestick Charts
Candlestick price charts are a popular type of price chart used in technical analysis. They provide detailed information about the price action of a financial asset over a specific period.
Moreover, depending on the chosen time frame, each candlestick on the chart represents a particular time interval, such as minutes, hours, days, or months. A candlestick is made up of the following components:
- Body: The rectangular portion of the candlestick represents the range from the opening to closing prices for the given period. It is typically colored or shaded to indicate whether the price increased or decreased during that period. If the closing price exceeds the opening price, the body is usually colored green or white. Conversely, if the closing price is below the opening price, the body is often colored red or black.
- Wick or shadow: The lines, also called wicks or shadows, extend above and below the candlestick’s body. They represent the highest and lowest prices reached during the period under consideration. The upper shadow indicates the highest price, while the lower shadow represents the lowest price.
By observing the patterns formed by multiple candlesticks on a chart, you can predict potential future price movements. Some commonly recognized candlestick patterns include doji, hammer, shooting star, and engulfing patterns. These patterns can suggest bullish or bearish reversals, continuation of trends, or indecision in the market.
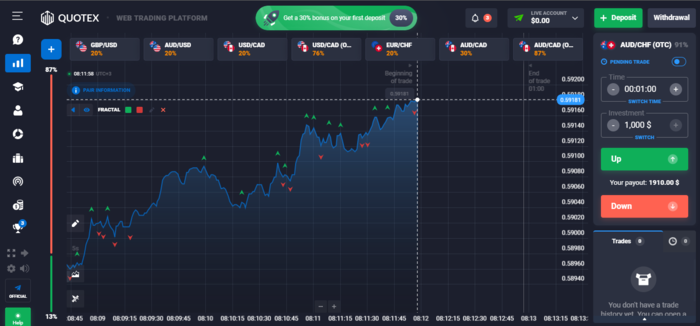
Line Charts
Line charts are a basic type of price chart used to represent the historical price data of a financial asset over a specific period. Unlike candlestick charts, which provide detailed information about the price range within a given interval, linear charts focus on connecting the closing prices of each period with a continuous line.
A line chart plots the closing prices on the y-axis (vertical axis), while the time intervals are represented on the x-axis (horizontal axis). A line is drawn to connect the closing prices from one period to the next, forming a continuous line depicting the price movement over time. You can see that in the image below.
Linear charts provide a simplified view of price action, allowing you to identify the general trend and direction of the asset’s price. They are useful for understanding long-term price movements, spotting trends, and evaluating the overall performance of an asset over a given period.
Although more detailed than candlestick charts, line charts can effectively identify support and resistance, trend lines, and significant price levels. Traders often utilize them alongside other technical analysis tools and indicators to understand price trends and make informed decisions.
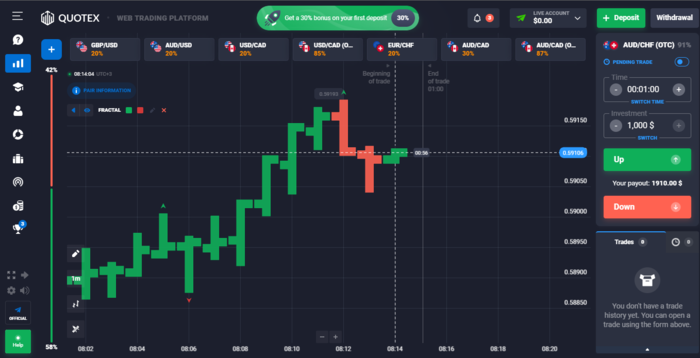
Bar Charts
Bar charts serve as a tool for technical analysis, allowing traders to examine prices and make trading decisions. By interpreting visual representations of market price movements through vertical bars, bar chart analysis reveals four essential data points: the high, low, opening, and closing prices of a financial instrument.
Furthermore, traders frequently combine bar chart analysis with additional technical indicators like moving averages and volume analysis to enhance their analysis. This combination provides a deeper understanding of the market and helps identify crucial trading signals.
As you can tell by now, having more than one technical analysis tool is important before entering trades. Additionally, historical analysis can be conducted using these charts to evaluate past price behavior and patterns.
In technical analysis, bar charts offer a systematic and visual approach to understanding market dynamics, recognizing price trends, assessing overall market sentiment, and making well-informed trading decisions.
Heiken Ashi Charts
Heiken Ashi charts are one price charting approach that seeks to remove noise and give a smoother picture of price patterns. The Japanese term “Heiken Ashi” (which translates to “average bar”) reflects the methods used to create these charts.
Each candlestick or bar in a Heiken Ashi chart is made using a modified calculation based on the average price movement. The formula considers the previous candle’s open, close, high, and low prices. Let’s look at how this works:
- Open price: The open price of a Heiken Ashi candlestick is determined by taking the average of the previous candle’s open and close prices.
- Close price: The close price is the average of the open, high, low, and close prices of the current candle. It represents the overall sentiment of the market during the given period.
- High and low prices: The high and low prices are determined by taking the highest and lowest values among the current candle’s high, low, and average open/close prices.
By calculating the open, close, high, and low prices using these modified formulas, Heiken Ashi charts aim to reduce the impact of short-term price fluctuations and emphasize the underlying trend. As a result, the chart tends to smooth out price movements and provide clearer indications of trend direction.
Heiken Ashi charts can be visually distinguished from traditional candlestick charts. Heiken Ashi candles are typically displayed as hollow or filled bars. Hollow bars (white or green) indicate an uptrend, while filled bars (red) represent a downtrend.
HOW TO CHOOSE THE RIGHT CHART TYPE FOR YOUR TRADING STYLE
Charts available on Quotex are all different, which means they each have pros and cons. Choosing the right chart type for your trading style is important, and the following considerations will help you in this process.
Technical Indicators
When selecting the right chart type based on the technical indicators you plan to use, consider the following guidelines.
Start by understanding the specific requirements of the technical indicators you intend to use. Some indicators rely on open, high, low, and close prices (e.g., candlestick or bar charts), while others may only require closing prices (e.g., line charts).
Second, assess the data points necessary for your chosen indicators. For example, if an indicator requires volume data, ensure that your chosen chart type includes volume bars or can be combined with a separate volume chart.
Different indicators may work better with specific chart types. For example, candlestick charts are widely used for Japanese candlestick pattern analysis, while line charts may be suitable for trend-following indicators or simple moving averages.
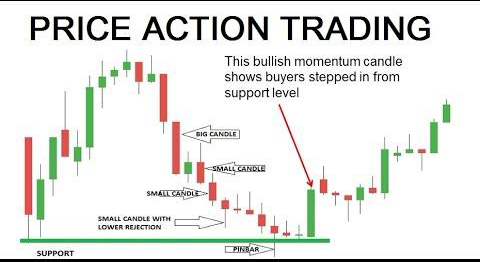
Price Action Analysis
Now let’s look at some considerations for selecting a chart type based on price action analysis:
- Candlestick charts: Candlestick charts are widely used in price action analysis due to their ability to depict detailed price movements. They provide information on opening, high, low, and closing prices, making them ideal for identifying candlestick patterns and understanding price behavior. Candlestick charts are suitable for analyzing candlestick patterns, such as doji, engulfing patterns, or hammers.
- Bar charts: Bar charts also offer a comprehensive view of price action, displaying opening, high, low, and closing prices. They can help identify key price levels, such as support and resistance zones, and understand the volatility and range of price movements. Bar charts are suitable for analyzing price swings, reversals, or chart patterns like double tops or bottoms.
- Heiken Ashi charts: These charts are mostly for price movements. They remove all other noise in the market by only showing blocks representing fixed price increments. These charts best suit price action traders because they focus on price movement.
- Linear charts: Line charts provide a simplified representation of price action, displaying only the closing prices over time. They are useful for identifying long-term trends, drawing trendlines, and understanding the overall direction of price movement. Linear charts can be an appropriate option if you prioritize trend analysis and prefer a clean and straightforward chart.
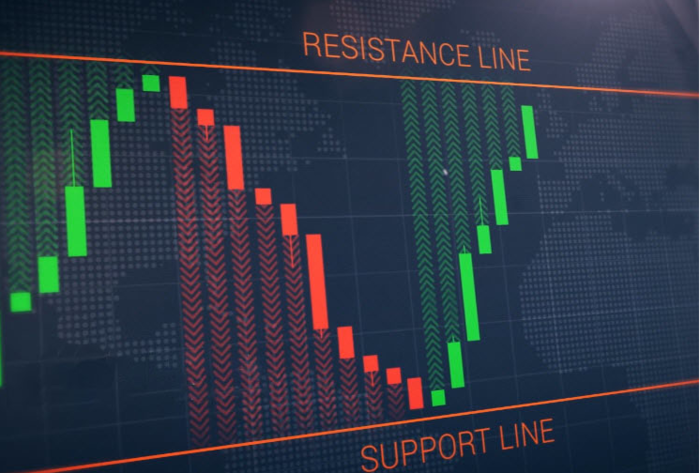
Support and Resistance Levels
Now, when it comes to choosing the right chart type based on support and resistance levels, you should also consider the following:
- Candlestick charts: Candlestick charts are often used to evaluate support and resistance levels. Candlestick wicks or shadows can reveal important details about the presence of support or resistance. Indicators of support and resistance levels to watch for include extended lower shadows (wicks) and long upper shadows. Candlestick patterns like dojis, hammers, and engulfing patterns can also shed light on potential reversals or continuations of support and resistance levels.
- Bar charts: Bar charts are another useful tool for displaying support and resistance levels. The horizontal lines created on the chart at particular price levels can identify areas of support or resistance. A support or resistance region will form when the price regularly bounces off a given level. These levels can be easily recognized and analyzed using bar charts.
- Linear charts: Although line charts offer a simplified view of price movements, they can still be used to locate points of support and resistance. Draw trendlines connecting the highs and lows to determine support and resistance levels. These trendlines can shed light on the strength and significance of the support and resistance zones.
- Heiken Ashi charts: Heiken Ashi charts concentrate on price changes and help determine support and resistance levels. These charts represent substantial price fluctuations and eliminate the noise. Look for brick formations (boxes) that touch or reverse around particular price levels, signifying support or resistance.
Different Time Frames
As a trader, you must also consider the time frame you will use for trading. Consider the following time periods when selecting a chart type.
Intraday trading (short-term): For intraday trading, where you focus on short-term price movements within a single trading day, shorter time intervals are commonly used, such as 1-minute, 5-minute, or 15-minute charts. Candlesticks or bar charts are often preferred since they provide more detailed information about price action during these shorter periods.
Swing trading (medium-term): Swing traders typically hold positions for several days to weeks, aiming to capture intermediate price swings. Charts with slightly longer time intervals, such as 30-minute, 1-hour, or 4-hour charts, are commonly used. Candlestick charts or bar charts can effectively analyze swing trading opportunities and patterns.
Position trading (long-term): Position traders focus on long-term trends and hold positions for weeks, months, or even years. Longer time intervals, such as daily, weekly, or monthly charts, are suitable for analyzing these trends. Candlestick charts, bar charts, or linear charts can be utilized for position trading, with line charts providing a smoother representation of long-term price movements.
Trading Signals and Patterns
Choosing the right chart type based on trading signals and patterns involves considering the type of signals or patterns you are looking for and the type that best displays them. Here are some guidelines to help you make an informed decision.
If you focus on identifying and trading with trends, candlestick charts or bar charts are often preferred. They provide detailed information on price action, making it easier to spot trend reversals, trend continuation patterns, and key support and resistance levels.
Candlestick charts are highly suitable for identifying reversal patterns, such as doji, hammer, engulfing patterns, or shooting stars. The visual representation of candlestick patterns is clearer on these charts.
For breakout strategies, charts that emphasize price action and remove noise are helpful. Heiken Ashi charts can be beneficial, focusing on significant price movements and filtering out small fluctuations.
Bar charts or candlestick charts are suitable for analyzing support and resistance levels by providing information on opening, high, low, and closing prices.
If you rely on pure price action analysis without complex indicators, candlestick charts or bar charts can provide the necessary information.
ADVANCED CHART SETTINGS
Charts on Quotex have advanced settings for online traders. Let’s explore what you need to know about these.
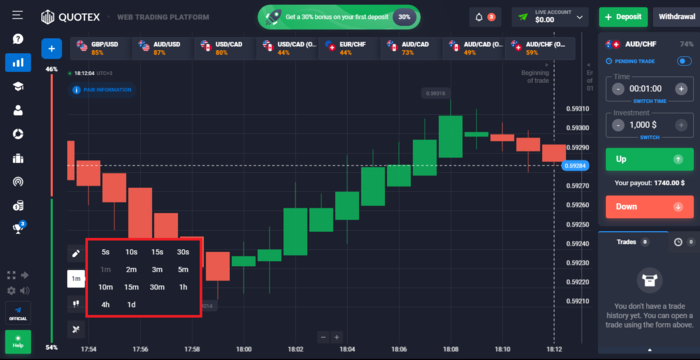
Configuring Financial Markets, Experienced Traders, and Real-Time Data
Configuring Financial Markets
Advanced Quotex chart settings allow traders to choose from various time frames, such as minutes, hours, days, weeks, or months. This flexibility enables traders to analyze price data at different levels of granularity, aligning with their trading strategies. In the image below, you can see some of the time frames you can use on Quotex.
Experienced Traders
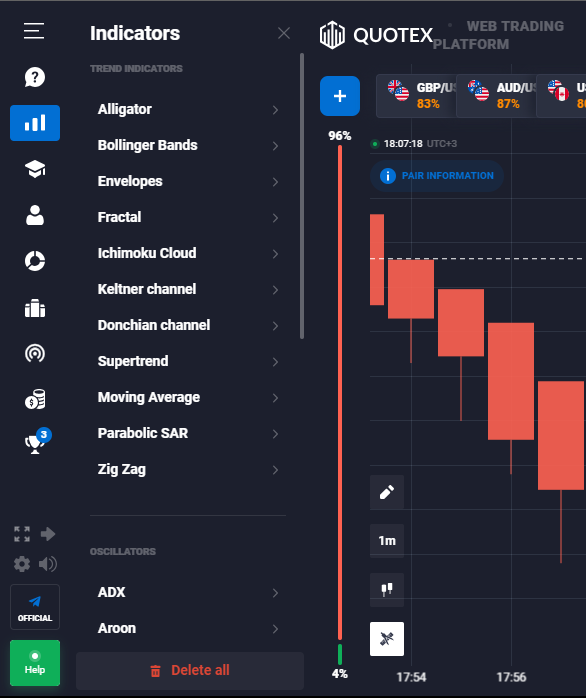
Advanced Quotex chart settings provide a wide range of technical indicators to be added to the charts. Experienced traders can customize and configure these indicators, adjusting parameters such as period length, smoothing methods, color schemes, and display preferences.
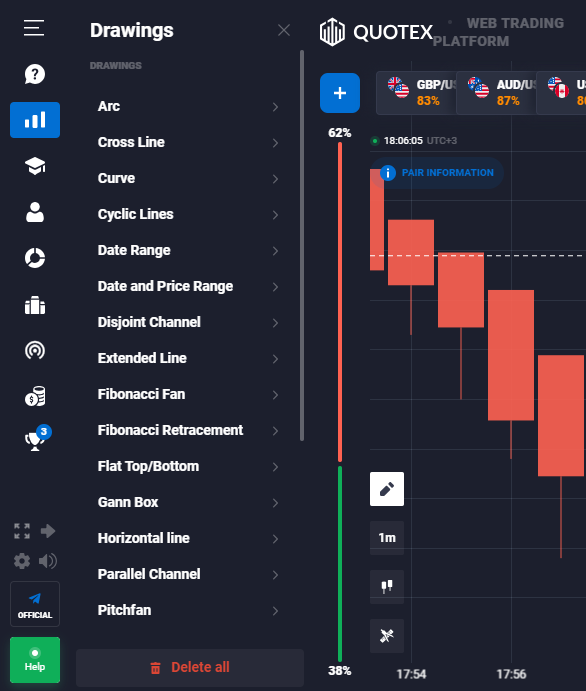
Advanced Quotex charting software also offers a variety of drawing tools, including trendlines, channels, Fibonacci retracements, and other geometric shapes. Traders can modify these tools’ appearance, thickness, and colors, allowing for precise analysis and annotations on the charts.
Real-Time Data
Moreover, traders using advanced Quotex chart settings have the convenience of linking their charting software to real-time data feeds from different sources, such as brokerage platforms or data providers. These settings allow traders to customize the data feed options, including connection protocols, refresh rates, and sources.
Adjusting Trading Skills, Online Platforms, and Potential Trades
Depending on your trading skills, you can adjust the features on charts to suit your needs.
Charts on Quotex provide you with a range of time frames to choose from, catering to both short-term and long-term trading preferences. These time frames include intraday options, like minutes and hours, as well as longer-term choices such as daily, weekly, and monthly intervals.
Advanced Quotex chart settings offer you the flexibility to choose from various chart types, including candlestick charts, bar charts, line charts, and Heiken Ashi charts. Each type provides distinct insights into price fluctuations and patterns. This allows you to select the most appropriate chart type for your analysis needs.
Lastly, Quotex offers a diverse selection of technical indicators that you can seamlessly incorporate into their charts. These indicators can be tailored to match individual preferences and trading strategies. Some popular options include moving averages, oscillators like RSI and the stochastic oscillator, volume-based indicators, trendlines, and Fibonacci retracements.
Setting Historical Prices, Current Prices, and Intraday Charts
Quotex provides the option to choose a specific time frame for historical price data. This includes daily, weekly, monthly, or custom intervals that best suit your needs.
The display of real-time data on the chart can be effortlessly enabled or disabled, allowing users to conveniently observe the latest price updates.
Finally, Quotex offers the functionality to specify the duration of each interval on the intraday chart. These intervals can range from 1-minute and 5-minute to 15-minute or even custom intervals.
Customizing Candlestick Charts with Real-Time Market Data
This section will look at customizing candlestick charts with real-time market data. Individuals have the opportunity to utilize various advanced Quotex chart settings when customizing their candlestick charts. These settings offer the ability to enhance analysis and tailor the chart according to specific needs. Here are some key settings that you may encounter.
Candlestick charts offer the flexibility to adjust the time frame, allowing you to view data in various intervals such as minutes, hours, days, weeks, or months. The choice of time frame depends on individual trading styles and the desired duration for analysis.
Additionally, Quotex provides several technical indicators that may be used with candlestick charts. These indicators can offer more information on price movement, market trends, momentum, volume, and other factors.
ADVANCED TOOLS FOR CHOOSING THE BEST CHART TYPES FOR YOUR TRADING STYLE
Below you’ll find detailed information about some of the advanced tools on charts that you can use for trading strategies.
Automated Trading Strategies
Quotex has some advanced tools and features supporting automated trading strategies. They include the following:
- Backtesting: Backtesting allows you to test your trading strategies using historical market data to assess your performance. It helps you identify strengths and weaknesses, optimize parameters, and gain confidence in the strategy before deploying it in live trading.
- Strategy development and coding: Many trading platforms provide integrated development environments (IDEs) or coding tools for traders to develop and customize their automated trading strategies. These tools may support popular programming languages like Python, JavaScript, or proprietary scripting languages specific to the platform.
- Strategy optimization: Optimization tools allow you to fine-tune your trading strategies by automatically testing different parameter combinations. By running simulations on historical data, you can identify optimal parameters that maximize performance metrics like profit, risk-adjusted return, or win rate.
BOTTOM LINE
As we have seen above, Quotex offers four chart types, namely the candlestick chart, linear chart, bar chart, and Heiken Ashi chart. These charts have different aspects that can aid with earning profits in online trading. Choose whichever chart works best with your trading strategies.