Mastering Price Action Trading on Quotex: Strategies and Indicators
Learn how to effectively incorporate price action analysis into your trading plan on Quotex, with strategies like breakout and pullback trading and technical indicators for enhanced accuracy.
-
 Saqib Iqbal
-
 Liz Kazandzhy
- 7 min read
Price action is an important aspect of online trading. Below you’ll learn how to successfully incorporate price action into your trading plan on Quotex.
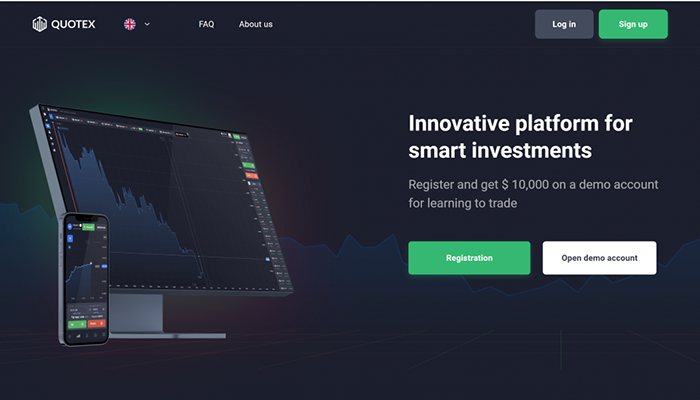
WHAT IS QUOTEX?
Quotex is an online brokerage firm that enables trading in various assets, including currency pairs, stock indices, cryptocurrencies, and commodities. The platform provides a risk-free demo account for practicing trading strategies. When ready, you can open a live trading account with various deposit options, starting as low as 10 USD and with no deposit fees.
Additionally, Quotex offers attractive bonuses of up to 35% as an added incentive. Their user-friendly trading platforms come with accessible customer support for any assistance.
INTRODUCTION TO PRICE ACTION
Before we cover how to use price action, let’s talk about what it is and why it’s important.
Definition of Price Action on Quotex
Price action refers to the price movement of a financial asset plotted over a specific period. It is the foundation for all technical analyses performed on charts of stocks, commodities, or other assets.
Traders heavily depend on price action, analyzing its patterns and trends to guide their trading choices. Technical analysis is a product of price action, utilizing historical prices in calculations that subsequently influence trading decisions.
Importance of Price Action in Trading on Quotex
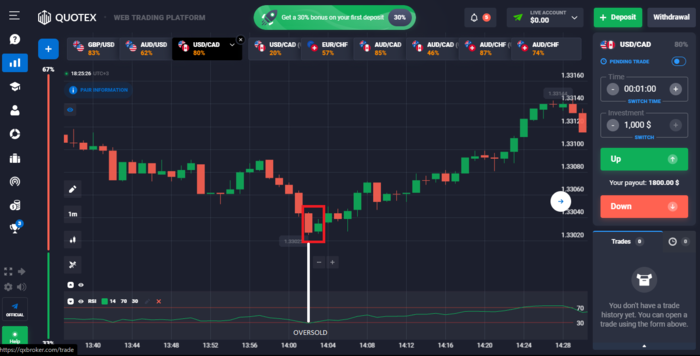
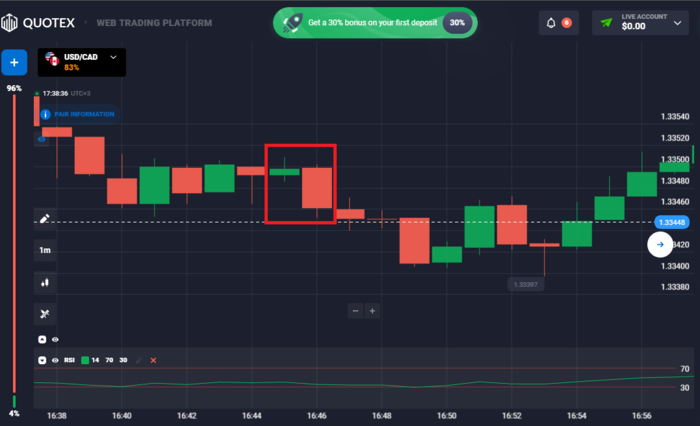
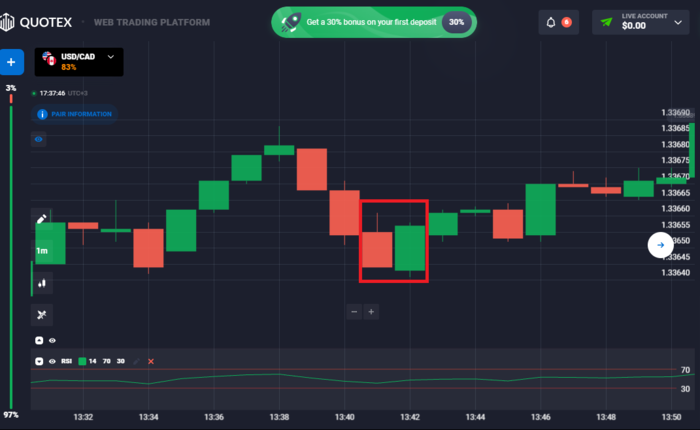
Experienced traders observe and analyze price movement through charts that plot historical prices over time. They employ various chart types to enhance their ability to identify trends, breakouts, and reversals. Candlestick charts are common because they help traders visualize price movements, presenting open, high, low, and close values.
Candlestick patterns, such as the harami cross, engulfing patterns, and three white soldiers, are visual representations of price action and are utilized to anticipate future price movements. You can apply these formations to different chart types, including point and figure charts, box charts, and box plots.
Furthermore, you can incorporate price action data when calculating technical indicators. In doing so, aim to find patterns and order in what may appear as random price movements. For example, applying the RSI to a price action chart might reveal a trend reversal. If the inside bar pattern, a form of price action, occurs when the RSI indicates an oversold market, there would be an increased chance of trend reversal.
ASPECTS OF PRICE ACTION
Price action is multifaceted. Let’s take a look at the main aspects of price action.
Understanding Candlestick Patterns on Quotex
Upward and downward price movements form candlesticks. Although these movements may seem random, traders often identify patterns from them for analysis and trading.
These patterns fall into two categories: bullish and bearish. Bullish patterns suggest a potential price increase, while bearish patterns imply a possible price decline. It’s important to note that no pattern is foolproof, as candlestick patterns indicate tendencies in price movements, not certainties. Here are some common candlestick patterns.
- The bearish engulfing pattern occurs during an uptrend when sellers outnumber buyers, indicated by a long red real body engulfing a small green real body. It suggests sellers are in control and that the price may continue to decline.
- On the other hand, the bullish engulfing pattern appears in a downtrend when buyers outpace sellers, represented by a long white real body engulfing a small black real body. It indicates bulls are gaining control and that the price may move higher.
- The bearish evening star is a topping pattern, identified by the last candle opening below the previous day’s small real body and closing deep into the candle’s real body two days prior. It signals a shift from buyers to sellers and may lead to further selling.
Understanding Candlestick Patterns on Quotex
A trend refers to the price movement in a specific direction over time, whether long-term, short-term, upward, downward, or sideways. Achieving success in forex market investments depends on your skill to recognize trends and strategically position yourself for profitable entry and exit points.
Different types of traders have varying time horizons when approaching the markets. Like position traders, long-term investors focus on primary trends to capture significant price moves and achieve profit goals.
Medium-term traders, such as swing traders, aim to capitalize on secondary trends that last from days to weeks. Conversely, day traders and scalpers are interested in minor trends for quick profits.
Whatever your trading approach, the key to success often lies in effectively timing trends. Identifying and opening positions as trends develop and closing them before they reverse can significantly enhance your market profitability.
PRICE ACTION TRADING STRATEGIES ON QUOTEX
You can incorporate price action into many trading strategies. Below we’ll cover some main strategies that can help you capitalize on price action and make a profit on Quotex.
Breakout Trading with Price Action
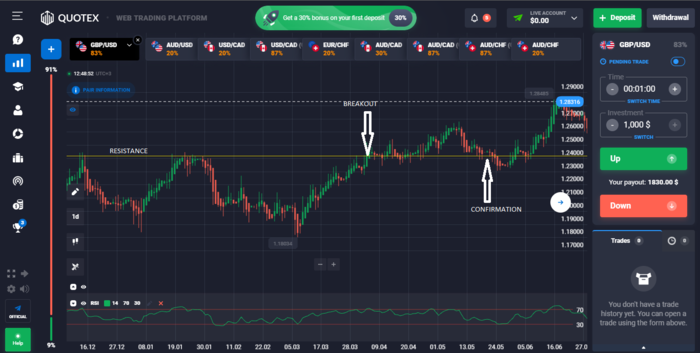
A breakout occurs when a security’s price moves beyond a predetermined support or resistance level with a higher trading volume. You must spot major resistance and support levels through price action to successfully trade this strategy. You can spot major resistance levels by locating levels where the price moving up has reversed the most times.
Major support, on the other hand, is when the level price moving down reverses the most times. For example, you can take long positions when a security’s price breaks above resistance or short positions when it breaks below support. After breaking the price barrier, volatility typically rises, and prices tend to trend in the breakout’s direction.
Breakouts are essential in trading because they often lead to increased volatility, significant price movements, and potential major price trends in the future.
Pullback Trading with Price Action
A pullback refers to a temporary pause or slight decline in a security’s pricing chart following recent highs while the overall uptrend remains intact. It resembles retracement or consolidation, and we often use these terms interchangeably. Pullbacks are typically short-lived, lasting only a few consecutive sessions before the uptrend resumes.
Pullbacks are great opportunities to buy after a security has experienced a significant upward price movement. For instance, a stock might surge following positive earnings news and then undergo a pullback as existing traders take profits by selling some or all of their long positions. Despite the pullback, the positive earnings serve as a fundamental indicator, suggesting that the stock will continue its upward trend.
Most pullbacks involve the security’s price retracing to a technical support area, such as a moving average, pivot point, or Fibonacci retracement level, before resuming the uptrend. You should closely monitor these critical support levels because a breakdown from them could indicate a reversal instead of a simple pullback.
Trading pullbacks is simple. All you have to do is identify an uptrend, wait for a pullback, and then enter the trade as the price continues in its uptrend.

INCORPORATING TECHNICAL INDICATORS WITH PRICE ACTION ON QUOTEX
To make price action more effective on Quotex, it’s a great idea to incorporate technical indicators. Here is a list of technical indicators and how to use them with price action.
Moving averages: Moving averages serve to smooth out price changes and recognize patterns. Combining the moving average with price action can help confirm the trend direction and potential entry or exit points. For instance, a bullish interior bar configuration above a 50-period moving average that is rising can suggest a potential uptrend that will continue.
Relative Strength Index (RSI): RSI calculates the speed and magnitude of price changes. It indicates the overbought and oversold conditions. When combined with price movement, RSI can indicate the potential for reversals or continuations. For example, a bullish disparity between the price and RSI that produces lower lows and a potential upward return can occur.
BOTTOM LINE
Price action is essential to online trading on Quotex. Price action is multifaceted, and you can apply it to numerous trading strategies. You can also incorporate technical indicators to increase your accuracy. All of these things can increase your chances of success while trading on Quotex.