Quotex Divergences: How to Trade with Confidence and Precision
Trade with confidence and accuracy using divergences on Quotex. Learn how to spot divergences, confirm signals, manage risk, and trade across various markets and timeframes. Master the art of trading with Quotex for successful online trading.
Trading with divergences is simple and can be extremely profitable. In this article, you’ll learn how to confidently trade divergences on the Quotex platform.
WHAT ARE DIVERGENCES ON QUOTEX?
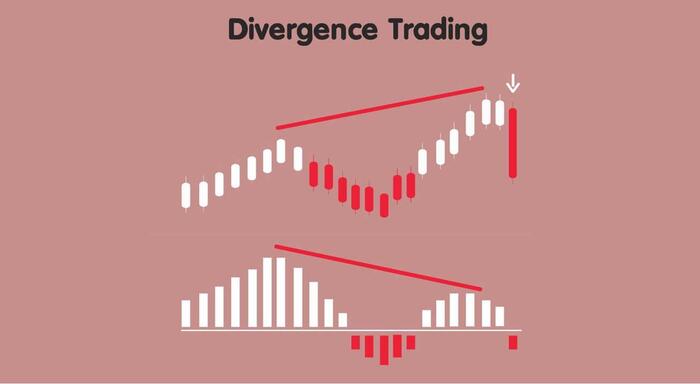
A divergence occurs when there’s a discrepancy between an indicator’s direction and an asset’s price movement.
A negative divergence occurs when the price of a security rises but a major indicator — like the Moving Average Convergence Divergence (MACD) or Relative Strength Index (RSI) — moves downward.
On the other hand, positive divergence happens when the price falls but an indicator begins to increase. These instances are usually reliable signals that the asset’s price may be about to reverse.
When using divergence for trading decisions, it’s important to note that indicator divergence can persist for extended periods. Therefore, you should use additional tools like trend lines and support/resistance levels to confirm the reversal.
Understanding divergence can help you recognize and respond to changes in price action. Divergence signals that something is changing, prompting you to consider various options, such as selling a covered call or adjusting stop orders.
However, problems arise when your ego interferes with making a profitable trade. It’s crucial to take the appropriate action based on the current price divergence rather than speculating on future outcomes.
Divergences are in two categories, bullish or bearish, and are classified by their strength. A Class A divergence on Quotex is stronger than a Class B divergence. A Class C divergence on Quotex is the weakest among them.
Experienced traders often disregard Class B and Class C divergences, considering them mere indicators of a volatile market. They only take action to protect profits during periods of Class A divergence.
Benefits of Trading with Divergence on Quotex
Trading with divergence on Quotex has many benefits, such as the following:
- Divergence on Quotex aids you in identifying and responding effectively to shifts in price action.
- It shows you when a change occurs and prompts you to make decisions like adjusting the stop-loss or securing profits.
- Observing divergence enhances profitability by serving as an alert for you to safeguard your gains.
TECHNICAL INDICATORS
Divergence is a concept that can be applied to various technical indicators. Let’s look at how to use technical indicators to trade price divergence.
Exponential Moving Averages (EMA)
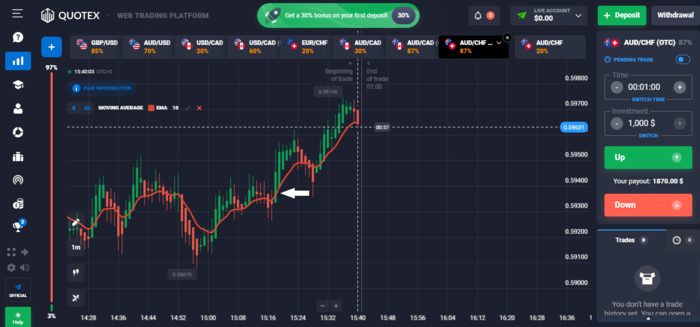
The Exponential Moving Average (EMA) gives more weight to recent price data than older data points. It is a commonly used technical analysis tool to smooth out price fluctuations.
Trading price divergence using EMAs is a popular strategy in technical analysis. Here’s how you can use EMA to identify price divergence.
First, plot two EMAs on your price chart: one with a shorter period (e.g., 9 or 12) and another with a longer period (e.g., 26 or 50).
You can then look for divergence between the price chart and the EMAs. Divergence occurs when the price moves in a different direction than the EMAs, signaling a potential change in trend.
- Bullish divergence: This happens when the price forms lower lows but the shorter EMA forms higher lows. It suggests a potential bullish reversal.
- Bearish divergence: This occurs when the price forms higher highs but the shorter EMA forms lower highs. It indicates a possible bearish reversal.
Confirm the divergence with additional indicators or chart patterns. You can use oscillators like the Relative Strength Index (RSI) or the Moving Average Convergence Divergence (MACD) to strengthen your divergence signal.
Before trading, consider the overall market conditions, support/resistance levels, and other relevant factors.
Lastly, enter a trade based on the anticipated reversal indicated by the divergence. Some traders may enter immediately, while others might wait for further confirmation, such as a breakout or a reversal candlestick pattern.
Moving Average Convergence Divergence (MACD)
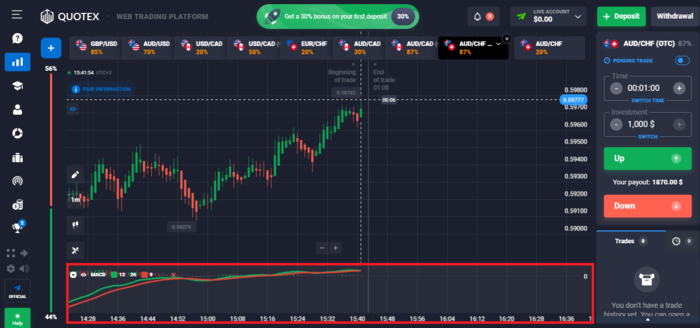
The Moving Average Convergence Divergence (MACD) indicator is a momentum oscillator widely used for trend trading. Unlike typical oscillators, it is not commonly used to identify overbought or oversold conditions.
The chart shows two lines oscillating freely without specific boundaries. When these two lines cross over, they generate a trading signal resembling a two-moving average system.
Here’s a general outline of how the MACD can be used to trade price divergences.
The MACD consists of two lines — the MACD line and the signal line — and a histogram. The MACD line is calculated by subtracting the longer-term Exponential Moving Average (EMA) from the shorter-term EMA.
The signal line is typically a 9-period EMA of the MACD line. The histogram shows the difference between the signal line and the MACD line.
First, identify price divergence: Price divergence occurs when the direction of the price and the direction of the MACD histogram diverge. Bullish divergence happens when the price makes lower lows while the MACD histogram makes higher lows. A bearish divergence occurs when the price makes higher highs while the MACD histogram makes lower highs.
Second, confirm the divergence: Divergence alone is not a sufficient signal to enter a trade. You should use other technical indicators or chart patterns to confirm the divergence signal. This can include trend lines, support and resistance levels, and other oscillators.
You can then enter the trade: Once you have identified a confirmed divergence signal, you can consider entering a trade. For example, you might look for opportunities to buy or go long in a bullish divergence scenario. In a bearish divergence scenario, you might consider selling or going short.
Lastly, manage risk and set targets: It’s essential to set appropriate stop-loss levels to limit potential losses if the trade doesn’t work out as anticipated. Additionally, develop profit targets based on your trading strategy. You can use support and resistance levels or technical indicators.
Understanding the Relationship Between These Indicators
When trading divergences on Quotex, the Moving Average Convergence Divergence (MACD) and the Exponential Moving Average (EMA) are closely intertwined indicators.
To calculate the MACD, subtract the shorter-term EMA from the longer-term EMA. It includes three components: the MACD line, the signal line, and the histogram. The MACD line represents the difference between the two EMAs, while the signal line is a smoothed version of the MACD line. On the other hand, the histogram reflects the difference between the MACD line and the signal line.
Divergence arises when the price of a financial instrument moves counter to the MACD. There are two types of divergence: bullish and bearish.
- Bullish divergence emerges when the asset’s price makes lower lows while the MACD forms a higher low. This indicates a potential weakening of downward momentum and a prospective bullish reversal. Therefore, it offers good buying opportunities.
- Conversely, a bearish divergence occurs when the asset’s price makes higher highs while the MACD forms a lower high. This suggests a potential weakening of upward momentum and a prospective bearish reversal. This may be a signal to sell or take a short position.
The MACD and the EMA work together to identify potential divergences in the price of an asset. You can use these indicators to identify momentum shifts and anticipate potential trend reversals, which can inform your trading decisions.
TRADING WITH QUOTEX: THE BASICS
To be a successful trader on Quotex, you must know the basics, which are explained below.
Forex and Stock Market Trading with Divergence on Quotex
Divergence trading is a popular approach in the Forex and stock markets. Here’s how divergence trading can be applied in these markets:
Forex market trading: In Forex trading, a bullish divergence occurs when the price forms a lower low but the indicator (such as MACD or RSI) forms a higher low. The downward momentum is weakening, and a potential bullish reversal may happen. In this case, consider buying the currency pair in anticipation of an upward move.
Bearish divergence in Forex, on the other hand, occurs when the price forms a higher high but the indicator forms a lower high. It indicates weakening upward momentum and a potential bearish reversal. Consider selling the currency pair or taking a short position in this case.
Stock market trading: In stock market trading, bullish divergence is identified when the stock price forms a lower low but the indicator shows a higher low. It suggests that selling pressure has weakened, indicating a potential bullish reversal. Here, consider buying the stock with the expectation of an upward move.
Bearish divergence in stocks, on the other hand, occurs when the price forms a higher high but the indicator forms a lower high. It implies weakening buying pressure and a potential bearish reversal. In this scenario, consider selling the stock or taking a short position.
Crypto Trading with Divergence on Quotex
You also can employ divergence trading in the crypto market. Consider the differences between price action and indicators to make decisions about trading. As you will see below, the case is the same for crypto trading.
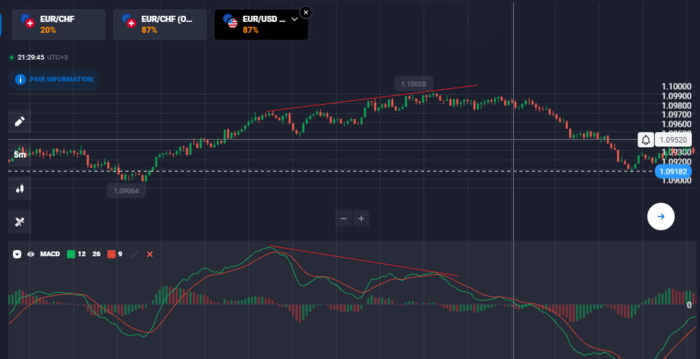
Bullish divergence in cryptocurrency trading occurs when the price creates a lower low but the indicator (such as MACD or RSI) creates a higher one. This implies weakness in the downtrend, and a probable bullish reversal is likely. You can, therefore, buy the cryptocurrency in hopes of an uptick.
Conversely, bearish divergence in crypto trading occurs when the price is making new highs but the indicator is making lower highs. It suggests a loss of upward momentum and the potential for a bearish return. Consider selling the cryptocurrency or holding a short position in it.
When using divergence trading on cryptocurrencies, it’s crucial to remember the crypto market’s extreme volatility and quick-moving nature. Therefore, make sure you manage risk appropriately.
5-Minute Chart vs. Weekly Chart Trade Setups
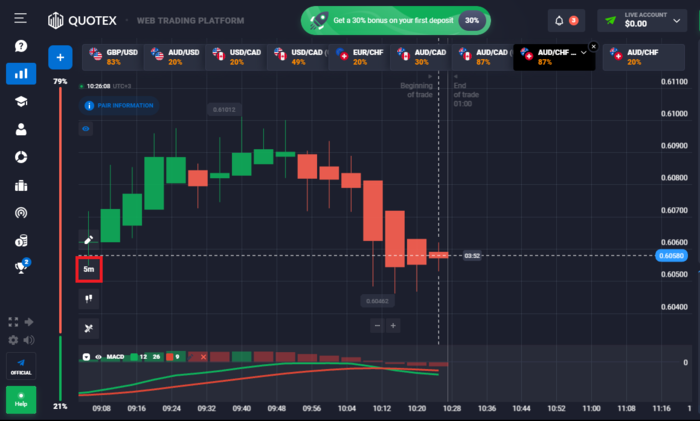
You can use the 5-minute chart when trading using the divergence strategy.
This trading strategy aims to identify short-term momentum bursts on 5-minute charts. With this strategy, you can capitalize on these bursts and promptly exit positions when the momentum begins to fade.
To begin with, you can use two technical indicators available on Quotex platforms. These are the 20-period Exponential Moving Average (EMA) and the Moving Average Convergence Divergence (MACD).
The preference for EMA over the simple moving average is due to its emphasis on recent movements, making it suitable for fast momentum trades.
While the moving average assists in identifying trends, the MACD histogram serves as a secondary indicator to gauge momentum. The default settings for the MACD histogram are the first EMA = 12, second EMA = 26, and signal line EMA = 9, all based on closing prices.
This particular strategy focuses on waiting for a reversal trade. However, it only capitalizes on the setup when momentum adequately supports the reversal to generate a substantial move.
You can exit the position in two separate segments. The first half enables the trader to secure gains, ensuring that a winning trade is not lost. The second half allows for an attempt to capture a potentially significant move with no risk since you have already adjusted the stop-loss to breakeven.
Weekly Chart
- Time horizon: A weekly chart is suitable for traders with a longer time horizon, such as swing or position traders. The aim is to capture broader market trends and hold trades for several days or weeks.
- Trend identification: Weekly charts provide a broader perspective on price trends and can help you identify major trend changes or reversals. Divergence signals on a weekly chart may indicate significant shifts in market sentiment.
- Reduced noise: Weekly charts filter out much intraday noise and offer a clearer view of the overall market direction. Divergence signals in this time frame can be more reliable and more significant.
Swing Trading Opportunities with Divergence on Quotex
Swing trading aims to take advantage of short- to medium-term price fluctuations within an established trend. It can be a suitable strategy for capitalizing on Quotex divergences. Let’s explore how this works.
Swing traders analyze established trends using tools such as trend lines, moving averages, or other trend-following indicators. The goal is to identify divergences within the existing market pattern.
Once you have identified a trend, you can then search for divergences between price and various oscillating indicators such as the RSI, Moving Average Convergence Divergence (MACD), or the stochastic oscillator.
Divergences occur when the price reaches a higher high or lower low but the indicator fails to confirm this movement with a similar high or low.
Divergences can serve as indicators of potential trend reversals or continuations. Bullish divergences, in particular, occur when the price forms a lower low while the indicator simultaneously forms a higher low. This suggests a possible transition from a bearish to a bullish market sentiment.
Bearish divergences occur when the price forms a higher high but the indicator forms a lower high. This signals a potential shift from a bullish to a bearish trend.
Finally, it is crucial to wait for confirmation before making a trade despite possible divergences indicating a potential reversal. To validate the divergence and determine your entry point, consider examining additional technical factors such as candlestick patterns, support/resistance levels, or trend line breaks.
EXPERIENCED TRADERS’ APPROACHES TO TRADING WITH QUOTEX
Experienced traders on Quotex often develop their own unique approaches to online trading. They base these approaches on their extensive knowledge, acquired skills, and personal preferences. Although these strategies can vary from person to person, below you’ll find some common techniques frequently employed by seasoned traders.
- Experienced traders often rely on technical analysis to examine price patterns, trends, and support and resistance levels. They also use various indicators for making informed trading decisions. They employ chart patterns, candlestick analysis, moving averages, and oscillators to identify optimal entry and exit points.
- Experienced traders on Quotex use technical and fundamental analysis to evaluate the intrinsic value of assets. In addition to examining economic indicators, company financials, news events, and market sentiment, they consider these factors’ potential impact on the market when making informed decisions.
- Traders on Quotex, with their experience, recognize the importance of effective risk management. They maintain balanced portfolios, minimize losses with stop-loss orders, and consider position sizes based on risk-reward ratios.
- On Quotex, seasoned traders frequently establish precise trading strategies and plans. They outline their overall trading approach, define risk tolerance, and establish clear criteria for entering and exiting trades. These practices aid in preserving discipline and consistency throughout their trading endeavors.
- To boost their expertise, seasoned Quotex traders understand the significance of ongoing education. They keep learning new trading methods and market patterns. Enriching their knowledge base involves attending educational events, reading financial literature, tracking accomplished traders, and actively engaging with virtual trading groups.
- Experienced traders on Quotex often backtest their approaches using historical data to validate their trading strategies. They analyze their past trades, identify patterns, assess performance metrics, and make necessary adjustments to improve their trading results.
BUILDING A CAREER WITH QUOTEX: TIPS FOR SUCCESSFUL TRADERS
You can build a trading career with Quotex. Here are some tips to do so.
Real Money, Thousands of People, and Profitable Opportunities
To protect your capital, implementing appropriate risk management strategies is important. This involves determining the capital you can risk per trade and establishing stop-loss orders to limit potential losses. It also involves using position-sizing techniques that align with your risk tolerance.
Capturing profitable trading opportunities is easier with a defined trading plan that reflects your goals, risk tolerance, preferred trading style, and strategies. This plan acts as a roadmap, ensuring you maximize your chances for success.
Developing a Deep Understanding of Time Frames
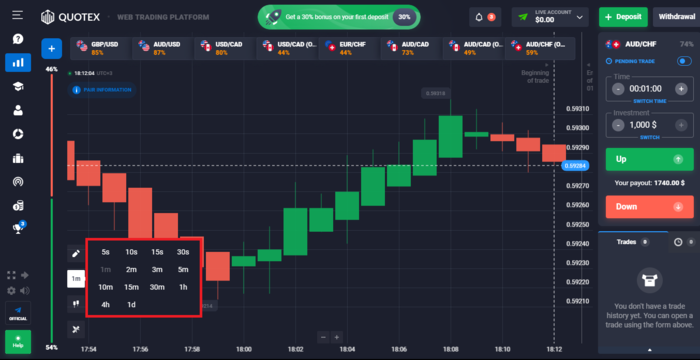
To build a career on Quotex, you need to understand time frames. Let’s walk through the basics of different time frames on Quotex.
Ensure that your trading goals are aligned with suitable time frames. If you prefer short-term trades and quick profit-taking, focus on lower ones, such as 5-minute or 15-minute charts. Higher time frames like the daily or weekly charts may be more appropriate if you’re more inclined toward longer-term positions.
Frequent price fluctuations and shorter-term trends are commonly found in lower time frames, resulting in more noise. In contrast, higher time frames offer a broader market perspective, showcasing significant trends with less noise. It’s important to know each time frame’s unique qualities and limitations.
BOTTOM LINE
Trading using divergences on Quotex is simple. It requires a deep understanding of technical indicators that show divergence. You can build a trading career on Quotex with the expert trading tips given in this article.


