Mastering Belt Hold Patterns: How to Spot Bullish and Bearish Signals on Quotex
Learn how to spot bullish and bearish signals using belt hold patterns on Quotex. Analyze candlestick charts and identify trend reversals. Trade with confidence and start earning today.
-
 Saqib Iqbal
- 5 min read
You can use belt hold patterns to improve your market analysis on Quotex. Let’s start by exploring how to spot bullish and bearish signals.
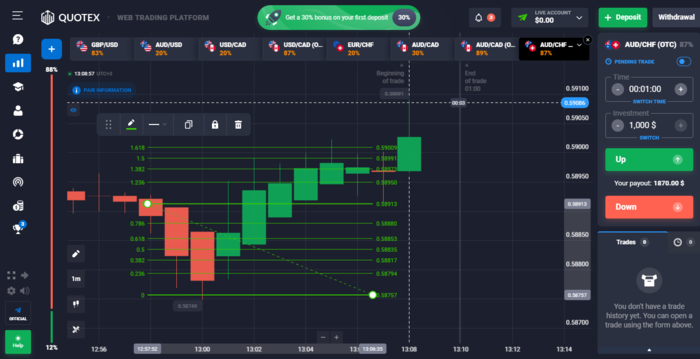
WHAT IS QUOTEX?
Quotex is an internet brokerage firm that allows you to trade various types of assets. These assets include 26 currency pairs, commodities such as gold and silver, a wide range of stocks, and cryptocurrencies.
Quotex offers several options for depositing funds, including bank cards, e-payment systems, cryptocurrencies, and bank transfers. It is worth noting that the company does not charge any fees for depositing or withdrawing funds from your account. You can open a real account with Quotex for just 10 USD.
Furthermore, Quotex provides different deposit bonuses based on the amount you deposit. These optional bonuses can go up to 35%.
Regarding the platform, Quotex has incorporated cutting-edge technology to provide a user-friendly interface with appealing visuals. The platform is backed by a customer support system available 24/7 in multiple languages, ensuring assistance for any issues.
Additionally, if you are new to online trading and want to explore strategies and become familiar with the platform, Quotex offers a risk-free demo account. This demo account is a secure environment to learn and build confidence in your trading abilities.

What Is a Belt Hold Pattern?
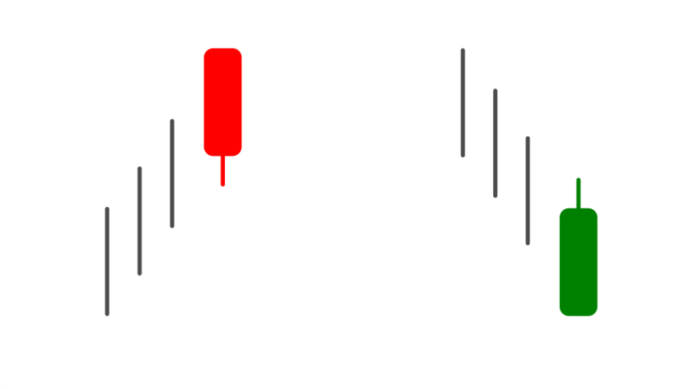
Belt hold patterns are candlestick chart patterns commonly observed in technical analysis of financial markets. They are characterized by a single candlestick representing a significant price shift and momentum.
The pattern is called “belt hold” because the shape of the candlestick resembles a belt, with the body of the candlestick acting as the “buckle” of the belt.
TYPES OF BELT HOLD PATTERNS
There are two types of belt hold patterns: the bullish belt hold pattern and the bearish belt hold pattern. These are discussed below.
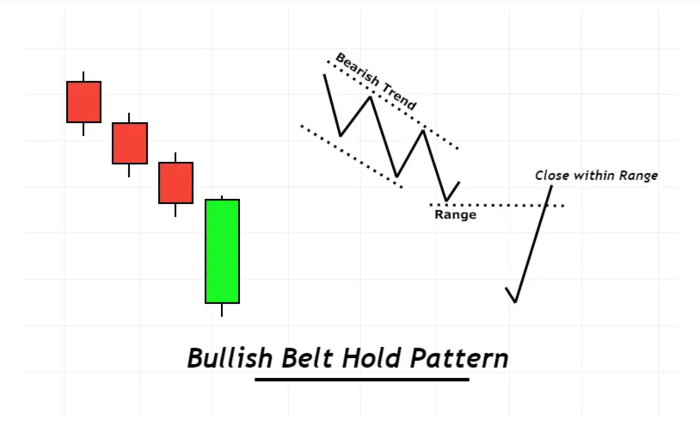
Bullish Belt Hold Candlestick Pattern
The bullish belt hold pattern emerges when the underlying asset’s price is downward, indicating the potential for a trend reversal.
This pattern can be observed on various time frames, but it holds greater significance on daily or weekly charts.
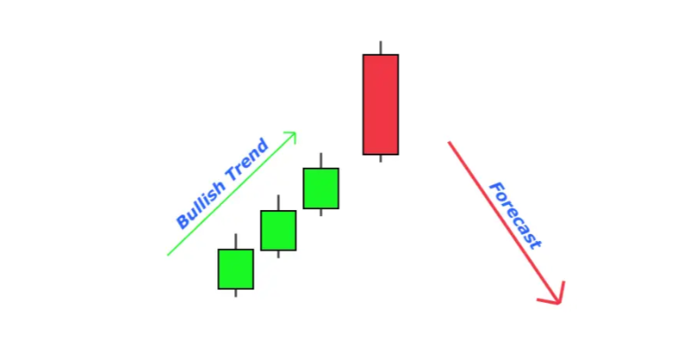
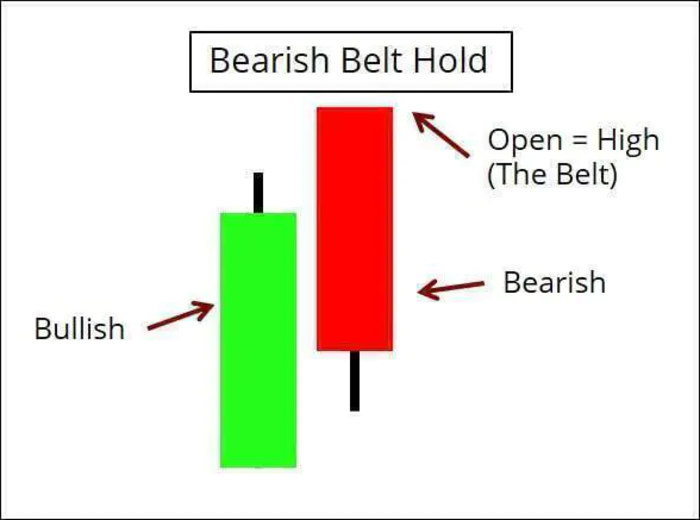
Bearish Belt Hold Candlestick Pattern
The bearish belt holds a candlestick pattern when there is an upward movement in the price chart.
The bearish belt hold pattern indicates a potential trend reversal. It is easily identifiable on the price chart, but it is important to exercise caution as it is a common pattern. Confirm the pattern by examining the previous candle, which should be a long bullish one.
The belt hold bar should be a long red one. Additionally, the candlestick that forms immediately after should be bearish to validate the signal.
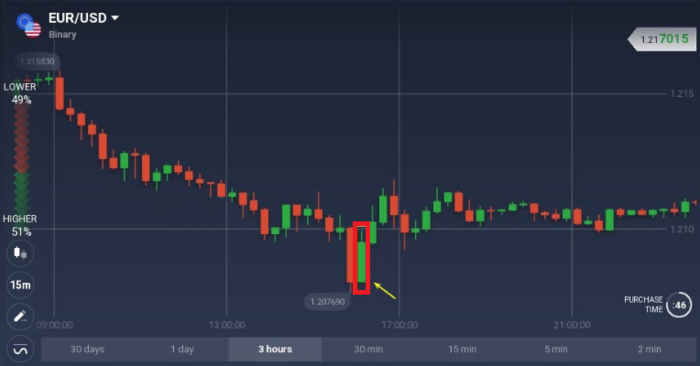
IDENTIFYING A BULLISH BELT HOLD PATTERN
Identifying a bullish belt hold pattern is simple if you follow the steps below.
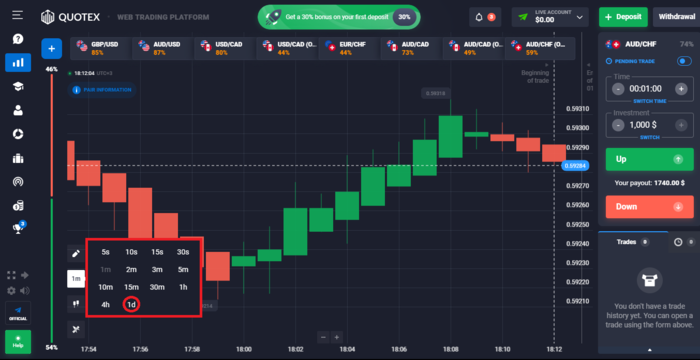
Step 1: Check the Period
This pattern can be identified in numerous time frames, though it is of greater significance in the daily and weekly time frames.
Step 2: Analyze the Candlestick Chart
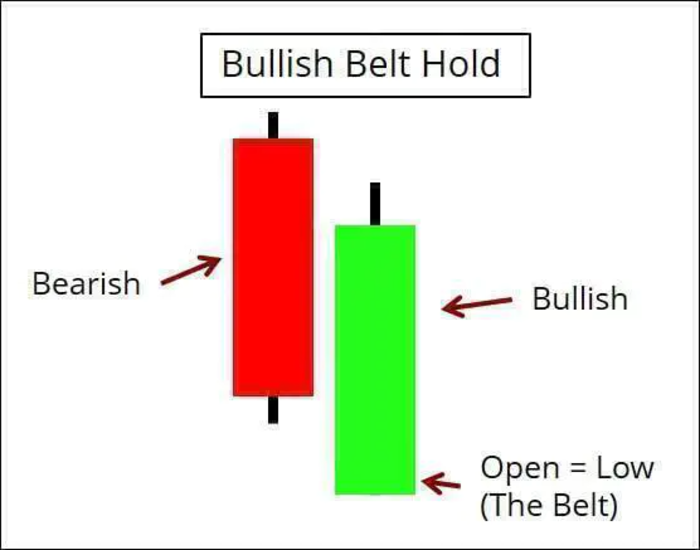
Identify several bearish (red or black) candles preceding the potential bullish belt hold pattern. These candles indicate the downward movement in price.
Look for a bullish (green or white) candle that forms after the bearish candles. This candle represents the potential bullish belt hold pattern.
Examine the body of the bullish candle. It should be relatively long, indicating strong buying pressure. The lower wick should be short or non-existent, and there should be no or minimal upper wick.
Step 3: Look for Closing Price and High/Low Reversal Signals
Confirm that the opening price of the bullish candle is lower than or similar to the closing price of the previous bearish candle. The opening price can be the same as the previous closing price on intraday charts.
Step 4: Confirm with Technical Indicators and Other Factors
You can corroborate this information with indicators such as moving averages and Fibonacci. Pay attention to resistance levels on charts. If you identify a belt hold pattern that served as a local peak, consider using it as a future resistance level.
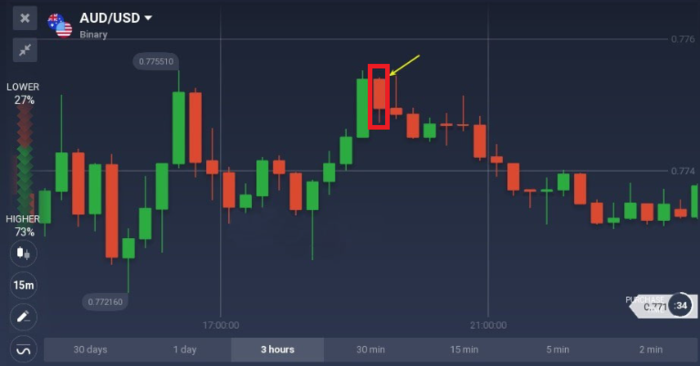
IDENTIFYING A BEARISH BELT HOLD PATTERN
Identifying a bearish belt hold pattern is simple using the steps below.
Step 1: Check the Period
Like the bullish belt hold pattern, this pattern can be identified in numerous time frames, though it is of greater significance in the daily and weekly time frames.
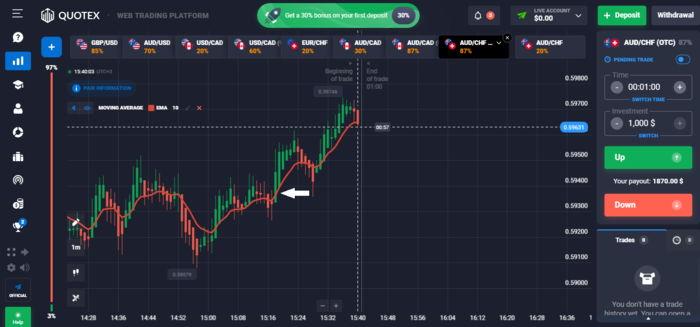
Step 2: Analyze the Candlestick Chart
Observe several bullish bars preceding the potential bearish belt hold pattern. The body of the bearish belt hold candlestick should be long.
The lower wick should be short, and there should be no upper wick or an extremely small one.
Step 3: Look for Closing Price and High/Low Reversal Signals
The opening price of this candlestick should be higher than the closing price of the previous bar. The opening price may be similar to the previous closing price on an intraday chart.
Step 4: Confirm with Technical Indicators and Other Factors
You can corroborate this information with indicators such as moving averages and Fibonacci. Pay attention to resistance levels on charts. If you identify a belt hold pattern that served as a local peak, consider using it as a future resistance level.
BOTTOM LINE
Now you know how to use belt hold patterns on Quotex for improved market analysis. The bullish belt hold indicates a potential trend reversal, while the bearish belt hold suggests a reversal from an upward movement.
These patterns can be identified by analyzing candlestick charts, considering opening and closing prices, and looking at the presence of wicks. Finally, it’s always a good idea to confirm the patterns using technical indicators and other factors.