The Quotex Fractals Indicator: How to Trade Binary Options with Chaos Theory
Learn how to trade options with chaos theory using the fractals indicator on Quotex. Identify reversal points and improve timing for accurate trades.
-
 Saqib Iqbal
- 14 min read
Quotex allows you to use the fractals indicator to trade various asset classes. Using chaos theory, this article will show you how to practice and excel in online trading.
WHAT IS THE FRACTALS INDICATOR ON QUOTEX?
The fractals indicator uses a common price pattern observed in financial markets. In non-trading contexts, fractals represent repeating geometric patterns across different time frames.
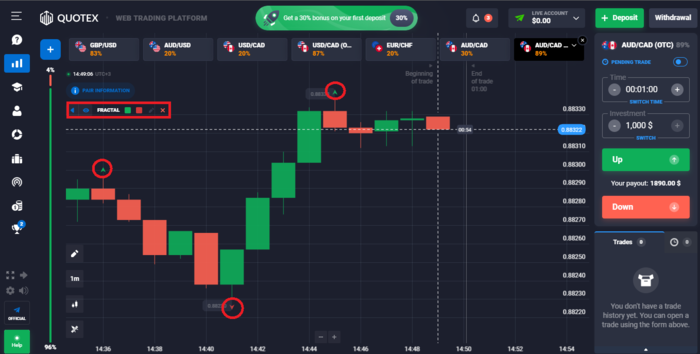
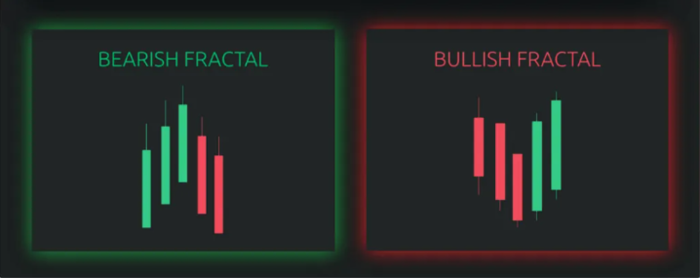
Building upon this idea, the fractals indicator identifies possible reversal points on price charts. By highlighting these patterns with arrows, the indicator shows their presence.
When a bullish fractal pattern emerges, it suggests a potential upward price movement. Conversely, a bearish fractal pattern indicates the possibility of a downward price movement. The indicator denotes bullish fractals with a downward arrow, while an upward arrow represents bearish fractals.
How Is Chaos Theory Used in Trading Binary Options?
Chaos theory examines irregular systems to identify patterns and consistencies within them. Its application extends to various domains, including weather prediction and stock market analysis. Essentially, chaos theory strives to reveal the structure of intricate systems that may initially appear disorderly.
Despite its origins in the 19th century, chaos theory gained significant momentum with the development of advanced computational techniques. This progress allowed researchers to delve into the intricate dynamics of complex systems, such as fluid dynamics and weather patterns.
Despite the seemingly simple equations governing these systems, even a minor difference in initial conditions can lead to unexpected outcomes.
While we do not use chaos theory directly in trading binary options, you may incorporate certain concepts or techniques inspired by chaos theory into your trading strategies. Here are a few ways in which you can loosely apply chaos theory principles in binary options trading.
Fractals Indicator Trading
As mentioned earlier, fractals are recurring geometric patterns in various time frames. You may use fractal analysis, inspired by chaos theory, to identify potential reversal points in price movements.
By recognizing fractal patterns on price charts, you can make decisions based on the assumption that the price will exhibit similar behavior in the future.
Nonlinear Dynamics
Chaos theory emphasizes the sensitivity of complex systems to initial conditions, often referred to as the “butterfly effect.” In trading, you can relate this concept to the idea that small changes or events can lead to significant price movements.
You may identify and exploit these nonlinear relationships to anticipate potential price changes. You can analyze market data, news events, or technical indicators.
Randomness and Probabilities
Chaos theory acknowledges that certain systems may exhibit random or chaotic behavior. In binary options trading, the determination of outcomes revolves around a straightforward “yes” or “no” proposition. You can use probabilistic models to gauge the probability of a specific event unfolding.
You can use Monte Carlo simulations or statistical analysis techniques to estimate probabilities and make informed trading decisions.
BENEFITS OF USING THE FRACTALS INDICATOR ON QUOTEX
The fractal trading indicator on Quotex has numerous benefits. Let’s walk through some of the more common benefits.
Increased Accuracy of Trades
One of the benefits of using a fractal trading indicator is that it can lead to increased accuracy in trades. Here are a few reasons why.
Identification of Reversal Points
Fractals represent potential turning points in price trends. By recognizing these patterns, you can pinpoint areas where the market sentiment may shift. This allows you to enter or exit trades at more favorable moments, increasing the likelihood of capturing good price movements.
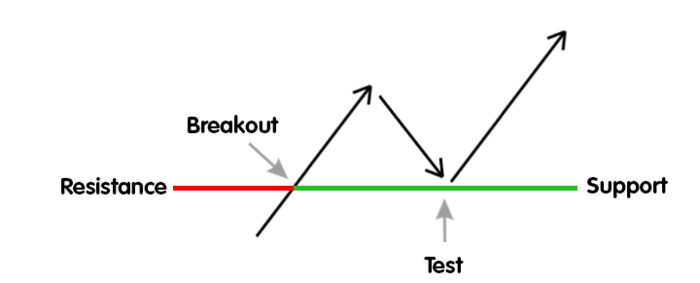
Confirmation of Support and Resistance Levels
Fractals can be a confirmation tool for identifying support and resistance levels on price charts. These levels indicate areas where the price has historically struggled to move beyond or has found significant buying or selling pressure.
By aligning fractal signals with these levels, you can gain additional confidence in your trading decisions and improve the accuracy of your entries and exits.
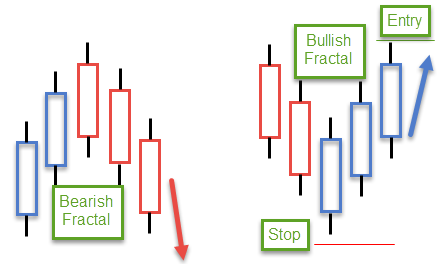
Clear and Recognizable Entry Points
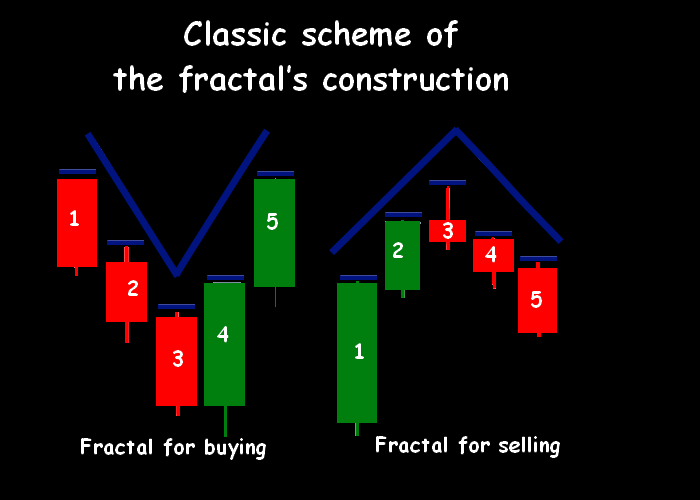
The fractals indicator offers you the benefits of clear and recognizable entry points in the market, specifically after the fifth candlestick in the pattern. Additionally, it gives you price levels for placing stop-loss orders.
In the case of a bearish fractal pattern, you would initiate a short sale and might position a stop-loss order slightly above the highest high reached within the fractal pattern.
Conversely, with a bullish fractal pattern, you would enter a buy trade at the close of the fifth candlestick and may place a stop-loss order just below the lowest low of the five-candlestick fractal pattern.
Reduced Transaction Costs
Using a fractal trading indicator can help you reduce transaction costs. Here’s how.
- By identifying potential reversal points in price trends, fractal indicators allow for improved timing in entering or exiting positions. This reduces the need for frequent transactions or adjustments, thus helping you save on transaction costs such as brokerage fees or spreads.
- By targeting patterns that qualify as fractals, you can eliminate the risk of acting on market noise and insignificant price changes. This systematic approach minimizes unnecessary transaction costs, significantly decreasing the number of trades.
- Highlighting significant price levels, such as support and resistance levels, fractal indicators offer clearer trade setups. When these levels coincide with fractal patterns, you get a stronger indication of potential market reversals or breakouts. This leads to more confident decisions and reduced transaction costs.
- Fractal patterns can be seen in different periods, ranging from brief to lengthy charts. By inspecting higher time frames, you can discover more accurate patterns that are more likely to succeed. This extended viewpoint leads to fewer trades and decreased expenses. This is because your focus shifts toward capturing substantial market shifts rather than being entangled in momentary variations.
Improved Market Analysis
Using the fractal trading indicator in market analysis can help you improve decision-making and potentially enhance trading outcomes. Here are some key advantages:
- The fractals indicator is invaluable in identifying potential reversal points in price trends by highlighting specific patterns on price charts. This helps you to pinpoint opportune moments to enter or exit positions. You can easily predict where a market shift is likely to occur.
- Fractals help you detect crucial points of support and resistance. These points illustrate price levels where the market typically slows down or reverses. You can intelligently determine when to trade or quit by identifying fractal patterns that show these points. You can also identify appropriate stop-loss and take-profit levels.
- Fractals help enhance trend analysis. They can help you assess the strength and direction of market trends. Observing the presence and arrangement of fractal patterns allows you to understand whether a trend is gaining or losing momentum. This information can assist in trend confirmation and allow you to adjust your strategies accordingly.
- Fractals exist across various time frames, from short-term to longer-term. This flexibility enables you to apply the fractals indicator to different trading strategies and time horizons. Whether you focus on day trading or long-term investing, the fractals indicator can provide valuable information across multiple time frames.
- The fractals indicator can be effectively combined with other technical analysis tools to strengthen the market analysis. Traders often use fractals with indicators such as moving averages, oscillators, or trend lines to validate signals and increase the reliability of their trading strategies.
THE BASICS OF FRACTAL GEOMETRY AND ELLIOT WAVE THEORY
Fractal geometry and Elliot Wave Theory are used in market analysis on Quotex to identify patterns and trends in price movements. Below is everything you need to know about these market analysis instruments.
What Is Fractal Geometry?
Fractal geometry is a mathematical concept and branch of geometry that studies self-similar and infinitely complex patterns. Mathematician Benoit Mandelbrot developed it in the 1970s.
Fractals are geometric shapes or sets that exhibit a unique property of self-similarity. This means it repeats the same pattern at different scales or levels of magnification.
Traditionally, Euclidean geometry deals with simple geometric shapes like circles, triangles, and squares with well-defined dimensions (such as length, area, and volume) and exhibits smooth and regular properties.
In contrast, fractals are irregular and complex and contain detailed structures that repeat at different levels. You can observe this self-similarity when zooming in or out on a fractal, revealing similar patterns at different magnifications.
We can apply fractal geometry in financial markets to analyze price charts and identify patterns that may indicate future price movements. Traders and analysts use fractal analysis to identify support and resistance levels, detect trends, and predict market behavior.
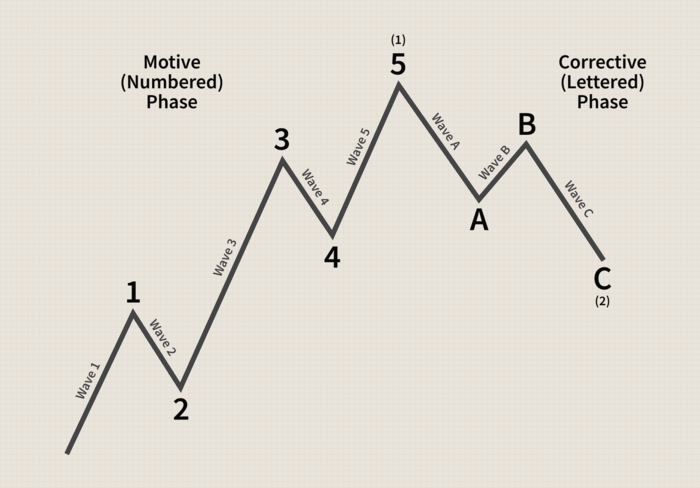
What Is the Five-Wave Sequence?
The five-wave sequence refers to a pattern within Elliot Wave Theory, a technical analysis approach used to analyze financial markets.
According to Elliot Wave Theory, price movements in financial markets unfold in a series of waves, alternating between impulsive and corrective waves. The five-wave sequence is specifically related to the impulsive wave structure.
In Elliot Wave Theory, an impulsive wave represents the direction of the larger trend. It comprises five sub-waves labeled 1, 2, 3, 4, and 5. These waves are further divided into smaller degrees, each with its own set of five sub-waves. The five-wave sequence is as follows:
- Wave 1: The first wave in the sequence is an impulse wave that moves toward the larger trend. It represents the initial movement in the direction of the trend after a period of correction or consolidation.
- Wave 2: The second wave is a corrective wave that retraces a portion of the gains made in Wave 1. It is usually a countertrend movement against the larger trend.
- Wave 3: The third wave is often the longest and strongest wave in the sequence. It represents the strongest movement in the direction of the larger trend. Wave 3 usually exceeds the high (in an uptrend) or low (in a downtrend) of Wave 1.
- Wave 4: The fourth wave is another corrective wave that retraces a portion of the gains made in Wave 3. It is typically a shallower and shorter-lived correction compared to Wave 2.
- Wave 5: The fifth wave is the sequence’s final wave and marks the larger trend’s last leg. It represents the last push in the direction of the trend before a potential reversal or larger correction.
How Do Technical Indicators Work?
Technical indicators provide insights into market trends, momentum, volatility, and potential reversal points. While specific indicators vary in their calculations and methodologies, they generally work by applying mathematical formulas to historical market data. They then generate visual representations or numerical values that you can interpret.
Here is a general overview of how technical indicators work:
- Technical indicators take input data, typically price and volume, as their primary input. You can represent this data in bar charts, candlestick charts, line charts, or other formats.
- The indicator applies specific mathematical formulas or algorithms to the input data. These formulas can involve various mathematical calculations, statistical computations, or complex algorithms designed to extract meaningful information from the data.
- The calculation result is typically presented visually on price charts as lines, histograms, dots, or other graphical elements. You can also represent this data as numerical values, such as oscillators or moving average values.
- You should interpret the indicator’s output to gain insights into the market conditions and make trading decisions. This involves analyzing the indicator’s behavior, patterns, and relationships with price movements. You may look for specific signals or patterns the indicator generates to identify entry or exit points, confirm trends, or anticipate reversals.
- Indicators are often used with other indicators, chart patterns, or fundamental analysis to confirm or validate trading signals. You can look for convergence or divergence between different indicators or cross-reference with other analysis techniques to increase the reliability of your trading decisions.
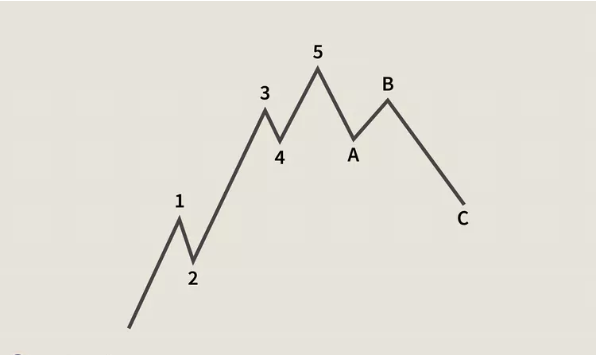
How Does Elliott Wave Theory Work?
Elliott Wave Theory suggests that market price movements unfold in a series of waves. These waves alternate between impulsive waves and corrective waves. Impulsive waves represent the direction of the larger trend, while corrective waves are countertrend movements against the larger trend.
You can classify waves into different degrees based on their scale and duration. The primary degree encompasses the largest trend, while smaller-degree waves are nested within it. Each degree consists of its own set of impulsive and corrective waves.
Traders and analysts apply wave counting techniques to identify and label the waves within a price chart. Impulsive waves are labeled with numbers (1, 2, 3, 4, 5), while corrective waves are labeled with letters (A, B, C). Labeling helps track the waves’ progress and identify potential turning points.
Elliott Wave Theory also uses Fibonacci ratios to determine waves’ potential length and retracement levels. Fibonacci retracement levels, such as 38.2%, 50%, and 61.8%, are often used to anticipate areas of support or resistance where price reversals may occur.
Elliott Wave Theory suggests certain relationships between waves. For example, Wave 3 is often the strongest and longest wave, while Wave 2 is a corrective wave that retraces a portion of Wave 1.
Wave 4 is another corrective wave that follows Wave 3, and Wave 5 represents the final leg of the larger trend before a potential reversal.
You should seek additional confirmation from other technical indicators, chart patterns, or fundamental analysis to validate Elliott Wave counts and trading signals. This helps reduce the subjectivity and increase the reliability of the analysis.
How Can These Strategies Help Traders?
These strategies increase traders’ chances of winning trades because they are crucial in market analysis. Traders make more informed decisions during trade entry, thus improving their win rate.
IMPLEMENTING THE FRACTALS INDICATOR ON QUOTEX TO TRADE BINARY OPTIONS
Using fractals to trade binary options is straightforward if you take the following steps.
Identifying Trends and Periods
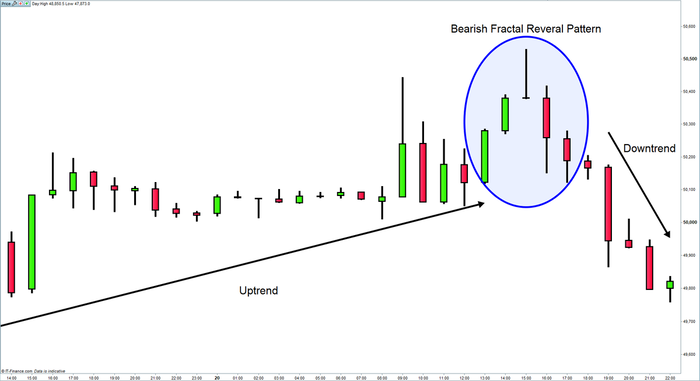
You can use fractals to confirm the existence of trends. An upward (bullish) trend is confirmed when a fractal with a higher high appears, while a downward (bearish) trend is confirmed when a fractal with lower low forms.
By observing fractals and their arrangement, you can gain insights into the strength and direction of a trend.
Fractals can help identify periods characterized by market reversals or consolidation. When the market is in a strong trending phase, fractals may appear less frequently, indicating a period of sustained price movement. Conversely, fractals may be more frequent during consolidation or ranging markets, indicating choppy or indecisive price action.
Consider using fractals with other technical indicators or analysis tools to validate trends and periods. For example, you can incorporate moving averages, trendlines, or oscillators to strengthen your analysis and confirm the signals provided by fractals.
As with any technical analysis tool, practice and validate the effectiveness of fractals in your trading strategy. Test different time frames, observe how fractals align with price movements, and evaluate their performance over many trades.
Understanding Resistance Levels and Support Points
When you identify a bullish fractal, it suggests a potential support level. This indicates that buying pressure may emerge around that level, causing prices to bounce higher. Consider these levels’ potential areas to initiate long positions or tighten stop-loss orders.
Conversely, when you identify a bearish fractal, it indicates a potential resistance level. This suggests that selling pressure may emerge around that level, causing prices to retreat. You can view these levels as potential areas to initiate short positions or place take-profit orders.
You should consider price action around the identified support or resistance level. A strong bounce or rejection of prices near a fractal level strengthens its significance as a support or resistance point.
Conversely, a break below a support level or above a resistance level could signal a reversal or a continuation of the trend.
BOTTOM LINE
The fractals indicator on Quotex presents you with a robust method for trading options by incorporating chaos theory principles. This approach involves identifying fractal patterns and applying concepts such as nonlinear dynamics and probabilities.
By leveraging these techniques, you can enhance your precision, minimize transaction expenses, and elevate your market analysis capabilities. Integrating the utilization of fractals with other indicators and strategies can provide additional reinforcement to trading decisions and enhance the probability of achieving favorable outcomes.